Woodlane
-
Posts
23 -
Joined
-
Last visited
-
Days Won
2 -
Speed Test
My Results
Woodlane's Achievements
Jr. Member (3/10)
6
Reputation
-
 CA3LE reacted to a post in a topic:
Auto Test - log 'place holder' for unselected test
CA3LE reacted to a post in a topic:
Auto Test - log 'place holder' for unselected test
-
iceb reacted to a post in a topic:
Auto Test - log 'place holder' for unselected test
-
 Please consider automatically logging a value of -1 for Upload, for example, when the user does not select Upload testing. Have average speed calculations exclude this 'place holder' value. Having some kind of 'place holder' entry of the unselected test will make Testmy Upload speed and Download speed points align above and below each other on our personal results graphs. Auto Test - log 'place holder' -1 when for unselected test Typo - Topic should read: " Auto Test - log 'place holder' for unselected test."
- 1 reply
-
- 2
-
-
CA3LE reacted to a post in a topic:
Statistical Process Control (SPC) Tool for Broadband?
-
Does anyone know of a site or utility that can calculate a cpk or similar metric from download and upload speed measurements? A lot of us us are concerned about the variability of our speeds, but I have not seen a tool that will actually quantify it. Maybe Testmy.net could add this as a feature from data that is being collected combined with the speed that the member is paying for. In the meantine I am looking.
-
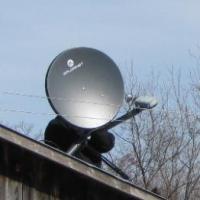
"as for IE, it seems to be sensitive and I often hear complaints about it being broken in some way or another."...I am not surprised since this is a Microsoft application. I usually use Firefox 13.0.1. I find that IE and sometimes Firefox act up especially when there are a lot of TCP Delays caused by 'traffic shaping'. The 600mS+ latency of satellite might also be a factor for me. When I get the time I will be moving to a Linux setup for monitoring. My hope is that sometime in the deep future rural high speed access reliability will be prdictable like picking up the phone or accessing my satelite TV programming. "I have just been curious not critical since I first started using TestMy, as to why IE8 is showing me speed results that are unusually higher than I have ever seen in 8 years," Possibly 'traffic shaping". I find that the ISP is able to adjust speeds dependent on the application. Typically time-dependent apps like VoIP are less affected than file transfer aps like FTP and BitTorrent. This is why I use these speed tests as tools to look at connection speeds when I experience sluggish performance. Sometimes there is a lot of disk access going on slowing my notebook unrelated to my broadband connection.
-
RRS1947 reacted to a post in a topic:
No graph on results page but data appears OK
-
Working OK now. All I did was reset my notebook again. My connection has been a bit sluggish bringing up the results page lately, so maybe my connection could have been causing the problem....
-
For last few days I have not been getting a graph on the results page even after waiting a while. I have cleared cache, restarted the notebook and tried a smaller sample size..

-
This was happening for both auto and non-auto tests. My results started mysteriously being logged again this evening. ....case closed. Might have been caused by some kind of corruption of data that I was sending.
-
For some reason, since Tuesday night, my tests are not showing up in my history (username: 'Woodlane') even though I am logged in an recording as usual. I have restarted my notebook and tried again, but issue persists.
-
Log Scale option for Results Graph?
Woodlane replied to Woodlane's topic in Ideas to make testmy.net better?
Mudman4..."...more precise.."..another option to a log scale might be the dual 'Y" axis scale to which you refer that would show the much lower value Upload speeds in more detail. Tdawnaz ...... a log is a scale type rather than a grap type. Bar and lines are graphing types. BTW... a possible bug in the existing graphing program.......the right end of download speed line is always shifted to the left of the upload spped line. The right ends of both lines are not under each other at the same data point. -
mudmanc4 reacted to a post in a topic:
Log Scale option for Results Graph?
-
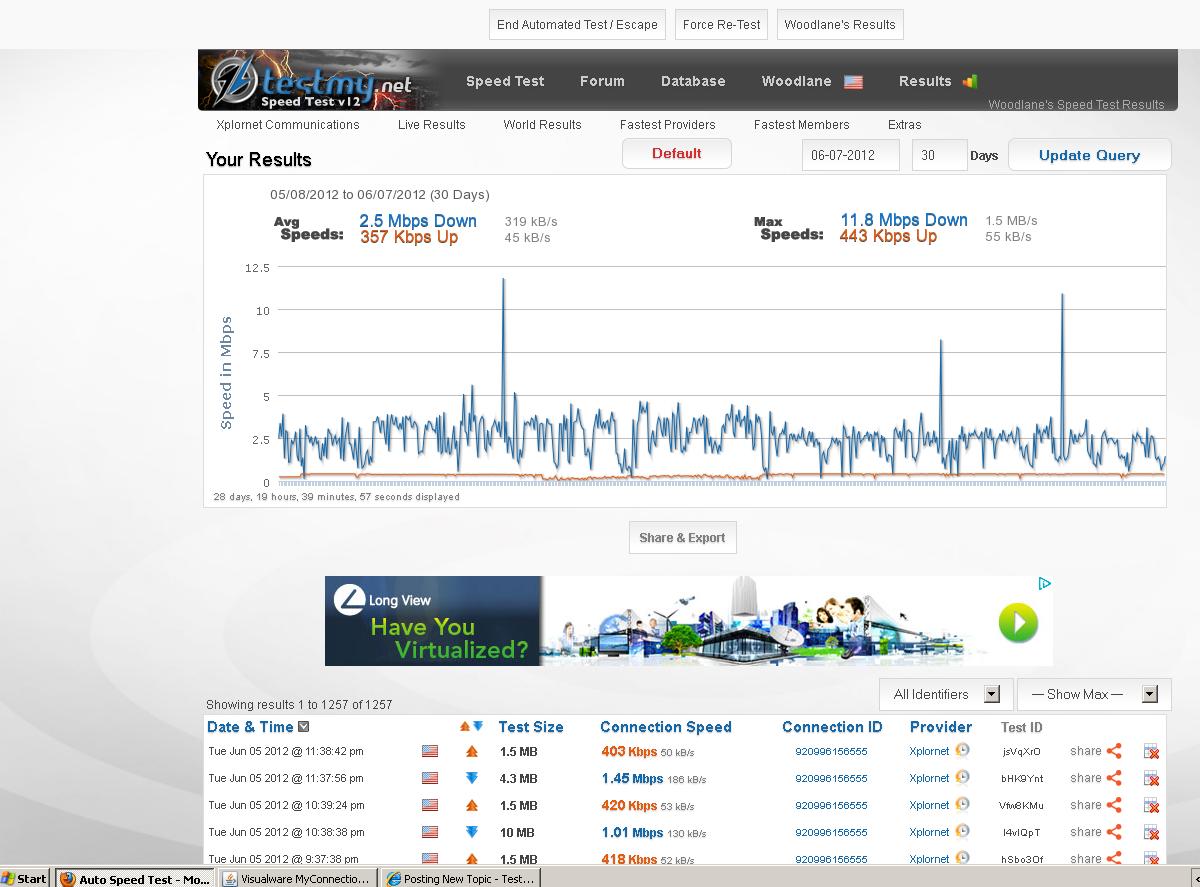
Upload speed is often much less than download speed to the point where it appears as a straight line near the bottom of the graph. A log scale would show fluctuations in upload speed much better.
-
It would be really helpful to have these two percentages calculated and added to the report and exportable to csv file for the Automated Speed Test. This would record how consistent download and upload speeds are being delivered. I experience some TCP pauses which affect performance and this would be a way to track ISP's improvements to service.
-
Woodlane reacted to a post in a topic:
Results Chart Labeling - "Next 25" - "Previous 25"
-
Set 'Y' axis scale on results graph?
Woodlane replied to Woodlane's topic in Ideas to make testmy.net better?
I was hoping to save that data because it might be a valid burst on a small filesize reflecting potential download speed capability of this new satellite. My other option would be to save the csv, then delete the data point as you suggest. Maybe in a future release this scaling feature might be a possibilty. -
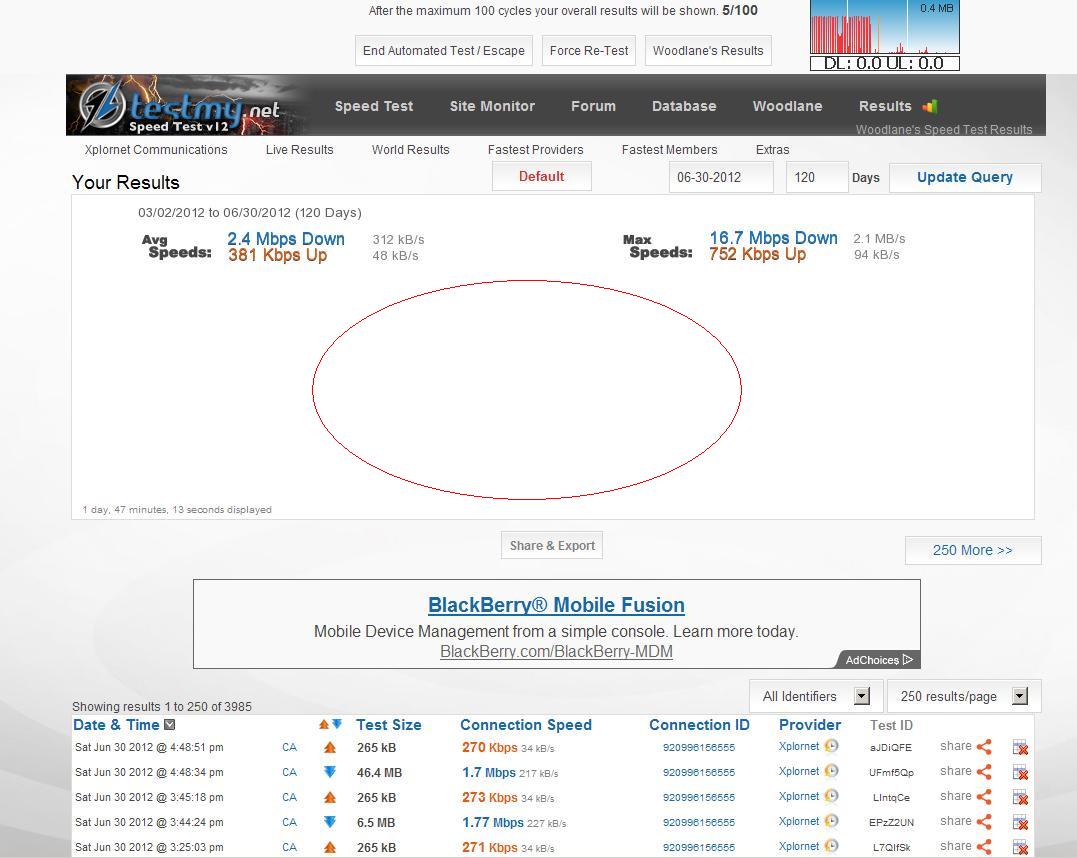
Would be nice to have a user-settable scale so that the effect of 'flyers' can be ignored. Most of my readings are around 3mbps. A 57 mbps resuly has made it hard for me see changes in normal results.
-
Especially for satellite connections with 400ms + latency.
-
Woodlane reacted to a post in a topic:
TestMy .... Latency?
-
For myself, my ISP if he wants to understand the data better to implement better service, and for any others who want to analyse the causes of performance changes. All the more reason to include a QOS percentage calculation in the exported csv file. The csv is a valuable tool in the challege to improve broadband for everyone.
-
What Testmy is missing -> reverse traceroute -> better bandwidth
Woodlane replied to addi's topic in General Discussion
For the speeds that I work with, I find Testmy results compare favorably with tools used by a network engineer. I really appreciate Testmy's tools particularly the data logging and flexibility of selecting test file sizes. It works for me. I have submitted a suggestion to add a QOS calculation to the data log csv file. For me, that would be of great benefit in understanding variations in speed at different times of the day.