Search the Community
Showing results for tags 'gnome-system-monitor'.
Found 1 result
-
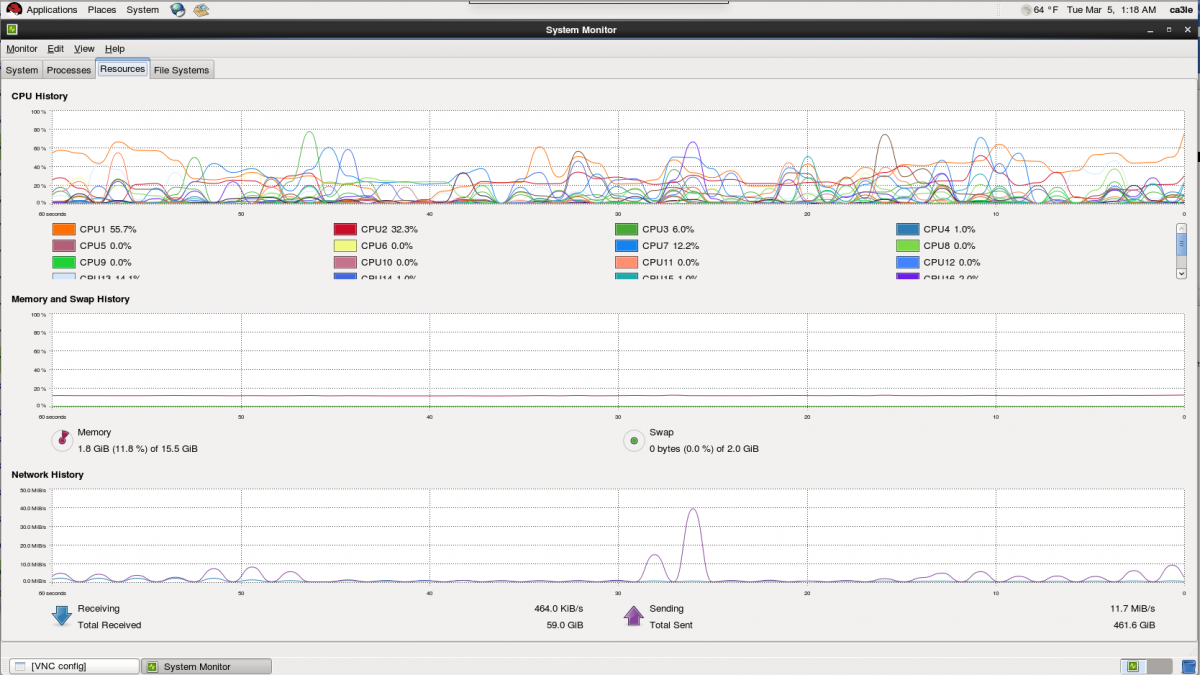
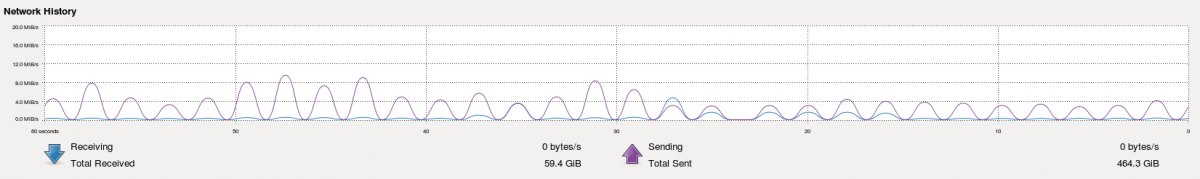
I thought this was kinda crazy looking. Here's what the system monitor for the home server looks like. So many processing threads I have to scroll to see them all. That's a lot of processing threads doing a lot of stuff. This is under off-peak load, I'll post a screenshot from the middle of the day later. The network history is kind weird, it goes in and out, I'm sure it's because of the bonding I have (combining two gigabit ethernet ports). Only reason I can think of that would cause a wavy pattern to emerge in that graph... when the actual connection is flowing steadily. Anyone know of a way to get gnome-system-monitor to report correctly for a bonded connection? Or does anyone know of another good linux system monitor available? This displays the pattern better. It goes in and out. Because it's balancing the load between two interfaces. I need to know how to tell it to look at the bond interfaces not eth1 or eth0 but I don't see options. I think if it looks at bond0 it will see them combined, which would result in a fluid graph... but I'm not sure.