
codie
-
Posts
7 -
Joined
-
Last visited
-
Days Won
1 -
Speed Test
My Results
codie's Achievements
New Member (2/10)
1
Reputation
-
OK - found "TiP Measurement Summary" pinned - makes sense. Thanks.
-
I have looked, but cannot find, specifications for the two figures one sees displayed when running auto tests over time on TMN. The top figure (TIP Summary) shows download speeds, but I cannot work out where the data are coming from - I assume the line averages everbody's readings submitted for any given time interval (ie global). The bottom graph plots up & download speeds for my tests, as far as I can tell. If so, is the top graph of any use to the "average" user - eg me, sitting in London?!! I suspect I misunderstand the purpose of the two plots. Thanks
-
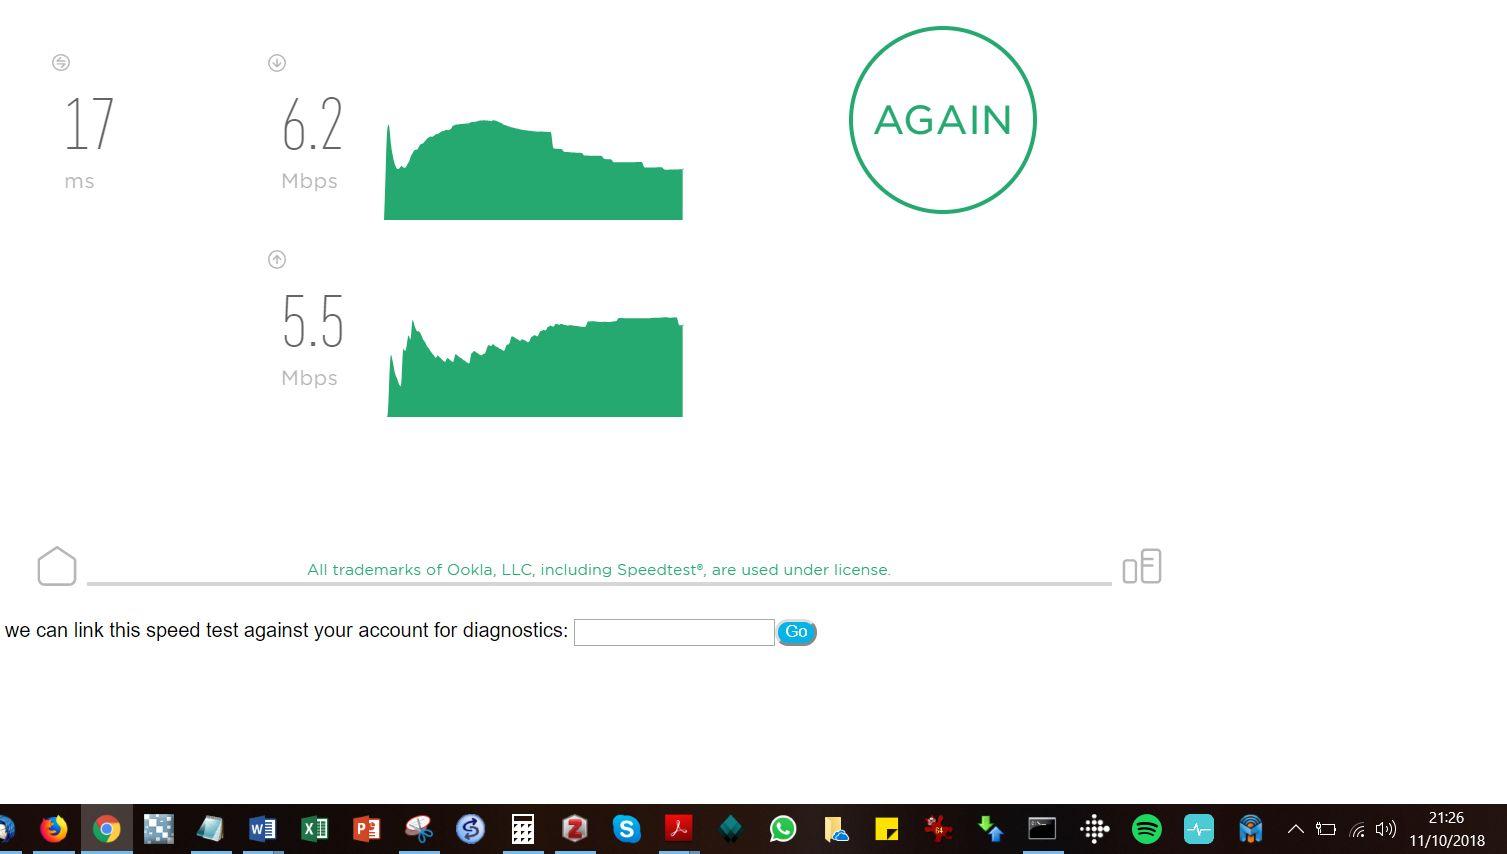
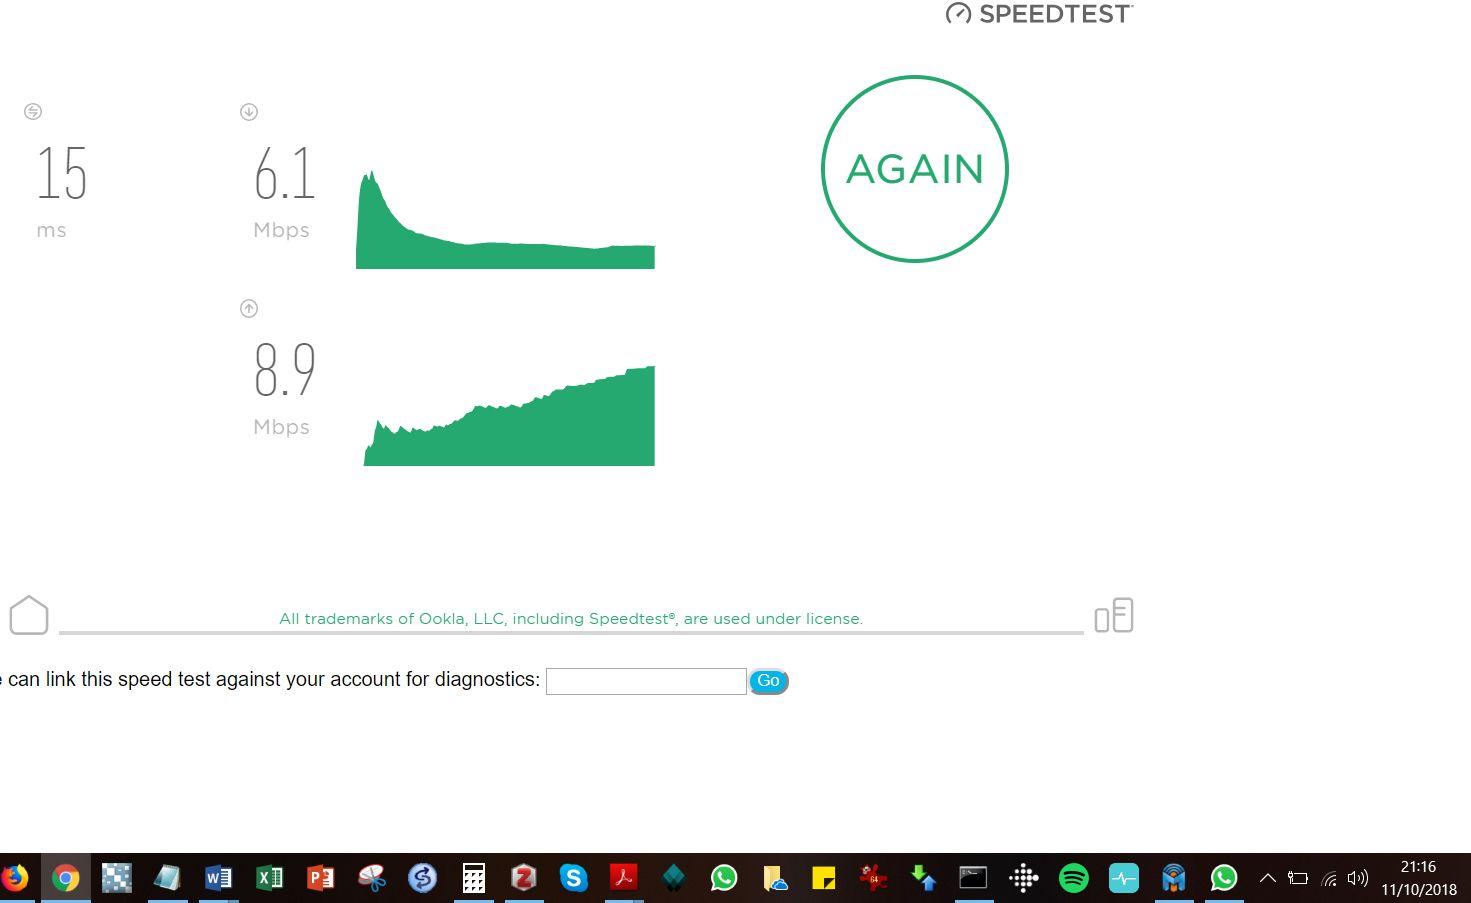
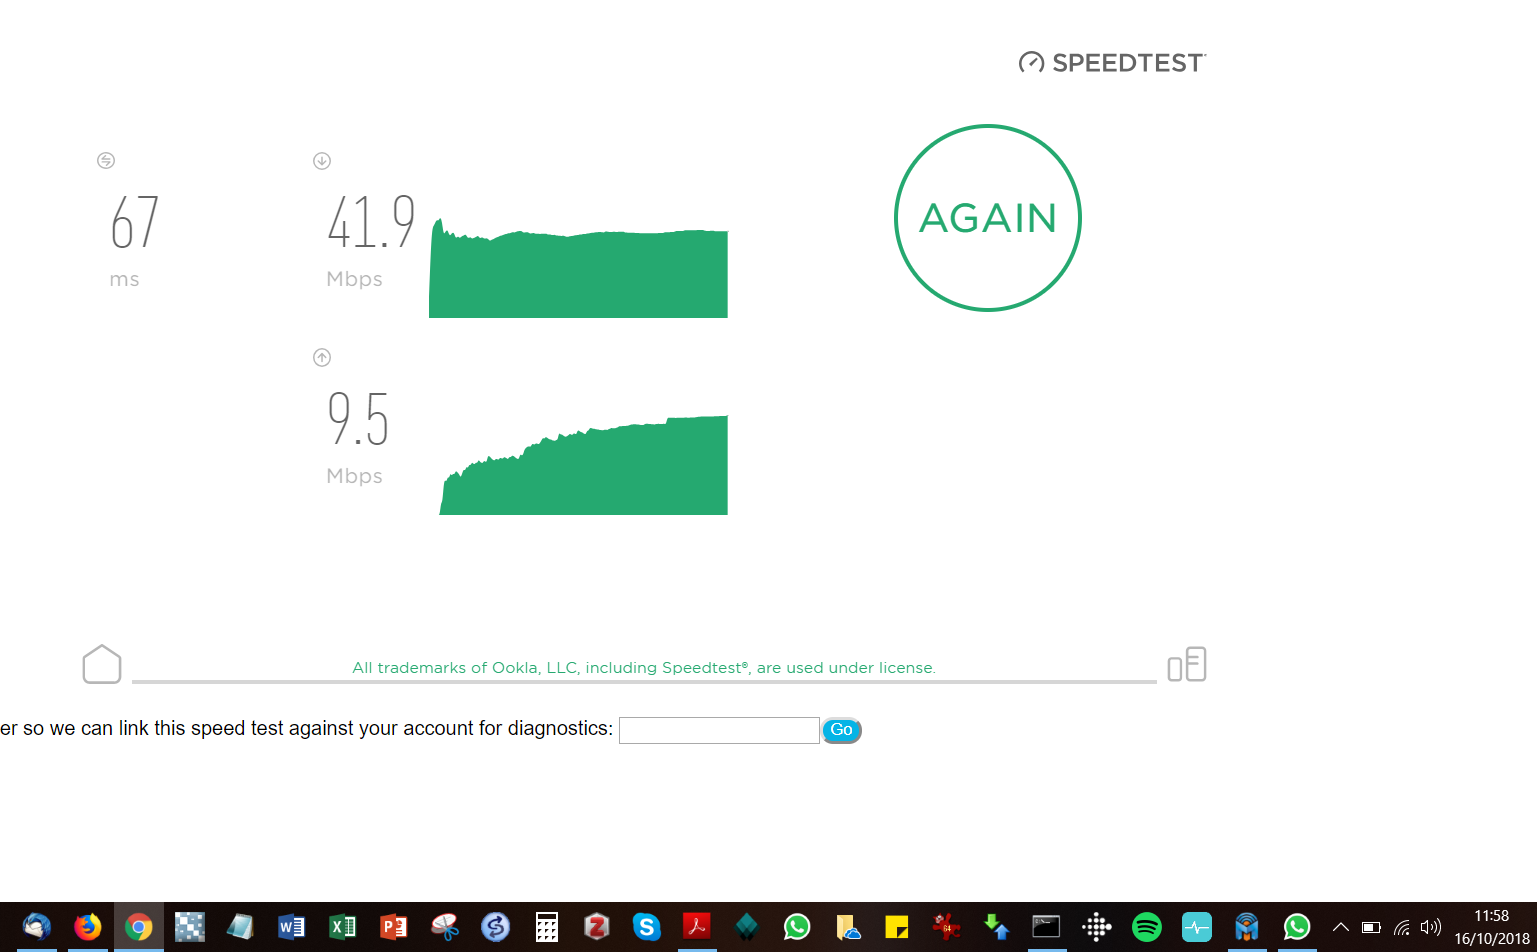
Whilst on the subject of understanding diagnostics, I also have the shape of the bandwidth with time (around 15s I would guess, altho I haven't measured this) - see attached. Normally, one sees some sort of positive curve, with a general increase, a slow down, and followed by plateauing - the two attached figures show very different behaviour for download speeds with time: a rapid increase in speed, and then a decline back down to some much lower speed (the uploads are more "normal", even if very jagged rather than smooth). It is almost as if the laptop is struggling to download the signal! This latter is HIGHLY non-technical, but do the download speeds indicate anything (other than weak signal & low bandwidth)? Thank you

-
OK - I have just posted my general rant re terrible ISPs (Different speed tests give different results) - now I am asking for a bit of help! Apart from low speeds (or, more accurately, my ISP not providing the bandwidth advertised), I have also had real problems with dropping. Measuring this is a hassle - taking screenshots everytime I am notified "server not available". Instead I have used ping -t command in the windows interface, & I then import the *.txt files into Excel & sort. "Destination net unreachable" and "Request timed out" indicate dropping, and by sequentially numbering each ping request, it is possible to determine if it is a major outage or just "one-off" drops. It is these one off drops I want to ask about - are these genuine incidents of "dropping" or to be expected in even the best kept broadband provisioning services? In other words, what are they indicative of? I give an example below: ID A B C D TIME ms TTL=43 DROP 634 Reply from 8.8.8.8: bytes=32 20 TTL=43 635 Reply from 8.8.8.8: bytes=32 20 TTL=43 636 Request timed out. XX 637 Reply from 8.8.8.8: bytes=32 19 TTL=43 638 Reply from 8.8.8.8: bytes=32 20 TTL=43 639 Reply from 8.8.8.8: bytes=32 20 TTL=43 Any thoughts appreciated. Thanks
-
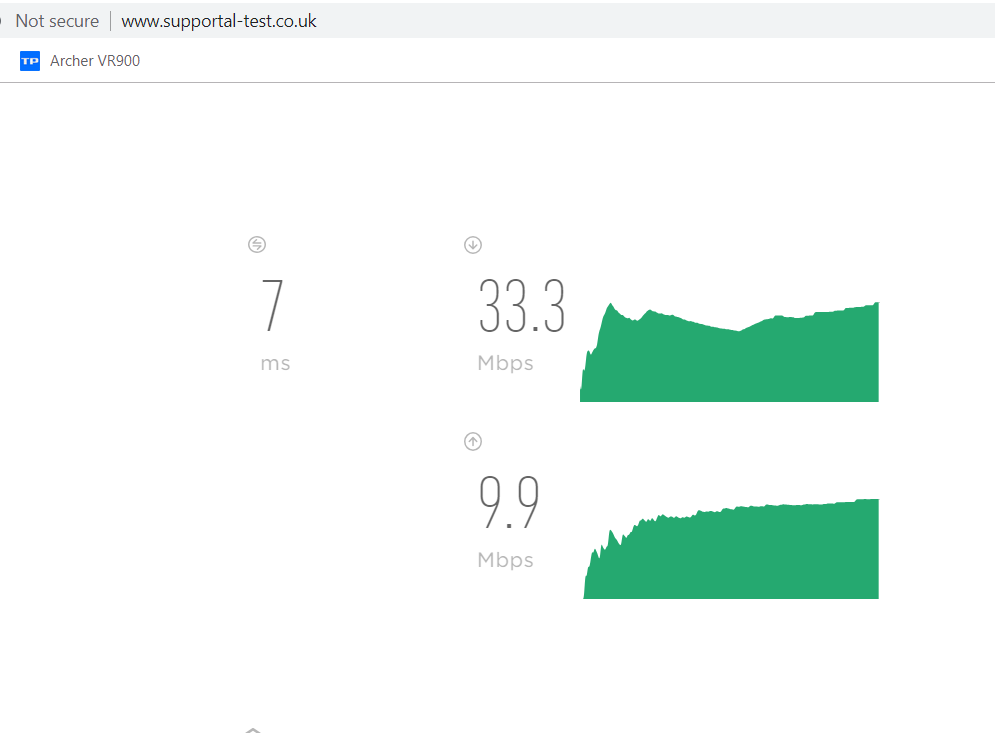
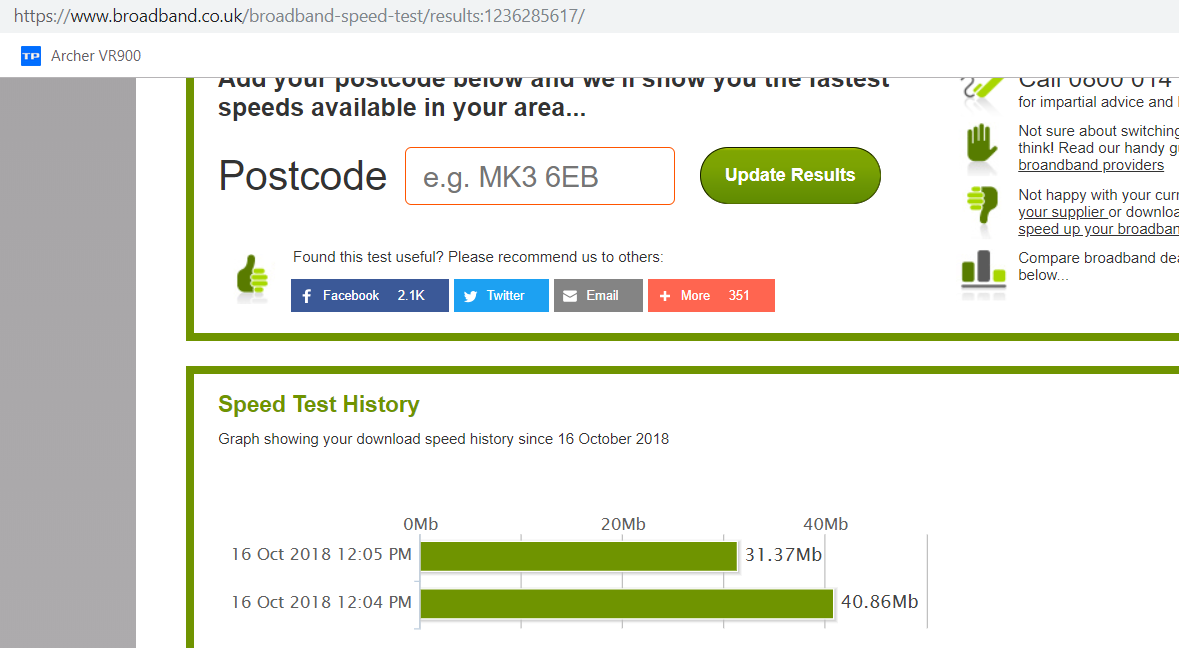
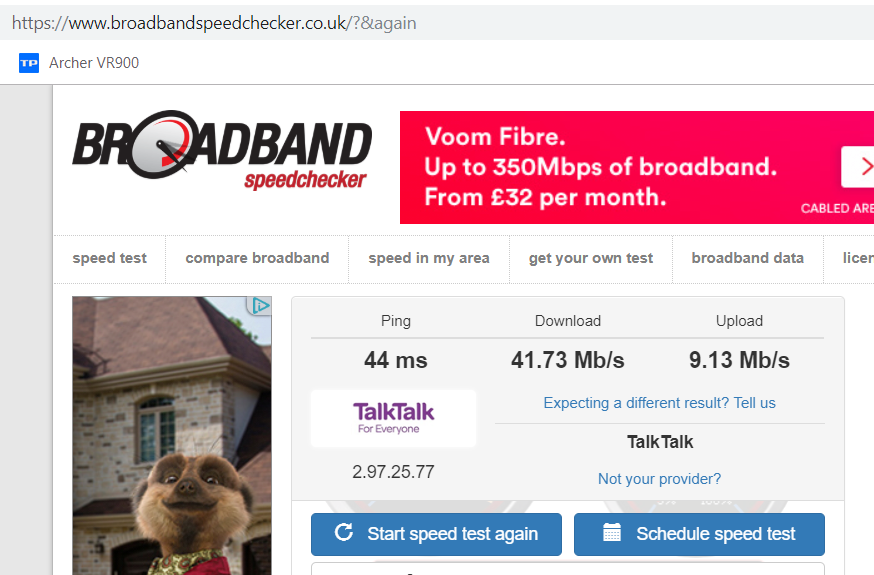
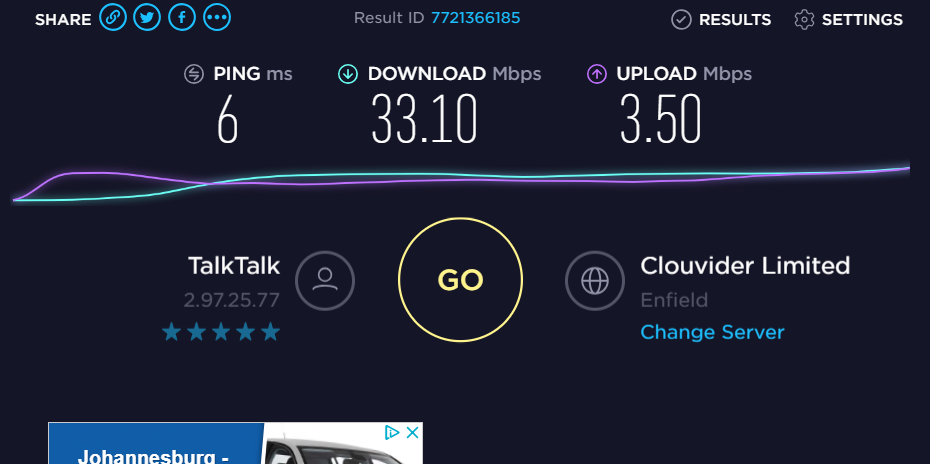
I have read the various threads on this topic already posted over a number of years, including your original pinned "Why Do My Results Differ From Speedtest.net / Ookla Speed Tests?" I attach a few sequential tests supporting your assertion! My query tho is this: over the past year I have had ongoing problems with my ISP (TalkTalk in the UK - it heads the league in number of complaints from customers saying their broadband speeds are atrocious and nothing like what are promised!). Anyway, for the past 4 weeks I have actually engaged with their fault reporting system, even tho it is a major pain (waiting in for engineer visits/holding phones which never get answered/repeating the problem & diagnostics for the 100th time etc etc) - Consequently I have been using your site (auto up/download every 5 mins 200x) & occasionally comparing the speeds you report to the ones I get on eg Ookla measured a few minutes later. Until my a few days back, I have actually found good agreement between the two sets of measurements - a mean download speed of around 40Mbps on both sites, and successive measures on the 2 sites not differing by more than 2-5 Mbps (so your site gives a reading of eg 39.2Mbps, & the speedtest.net a few minutes later giving a reading of eg 42.9Mbps). Basically differences I can live with. However, following yet another engineers visit (I should be getting closer to 76Mbps, but of course they say they will provide between 48 & 70 Mbps) I found the two speed test sites diverging - you are consistently showing < 40Mbps (and fluctuating (downwards)), whilst they show steady download speeds of 50 - 53 Mbps - this of course taking them above their minimal agreed provisioning rate, but as far as I am concerned is capped. I am also dubious of the consistency in their repeated measures. Unfortunately, what I have written above represents about the limit of my technical understanding, & so I will just have to live with it. I wrote a formal letter of complaint yesterday with a load of technical data backing up my argument (so THANKS Testmy.net!!), but other than threatening naming and shaming to OFCOM there is little to do other than withdraw my custom, but the other ISPs are probably little better! What amazes me is that delivering an acceptable broadband service to customers in London should not be rocket science - what is the problem?!!
-
 CA3LE reacted to a post in a topic:
Export Test Results
CA3LE reacted to a post in a topic:
Export Test Results
-
CA3LE - many thanks - will give it a try tomorrow evening (currently running another auto 5 min x 200)
-
Hi - I am sure there must be the facility - I just can't find it!! I would like to export my up/download speeds as a csv or txt file. Can this be done? Many thanks