
CrazyAboutNature
-
Posts
22 -
Joined
-
Last visited
-
Days Won
1 -
Speed Test
My Results
Everything posted by CrazyAboutNature
-
Where do I sign-up for the 680Mbps/41Mbps... I'm ready!
-
Yes, happy to give it a try. At some point I was getting overwhelmed by my sensor notifications, so some control of when and if to get an email notification would help. I'm also struggling a bit not knowing if some of the problems I'm seeing might be on my end, and not sure if there might be some way for me to evaluate this, other than rebooting and resetting my modem to see if everything clears-up. Thanks.
-
Missing tests are not documented
CrazyAboutNature replied to CrazyAboutNature's topic in General Discussion
Thanks. -
Missing tests are not documented
CrazyAboutNature replied to CrazyAboutNature's topic in General Discussion
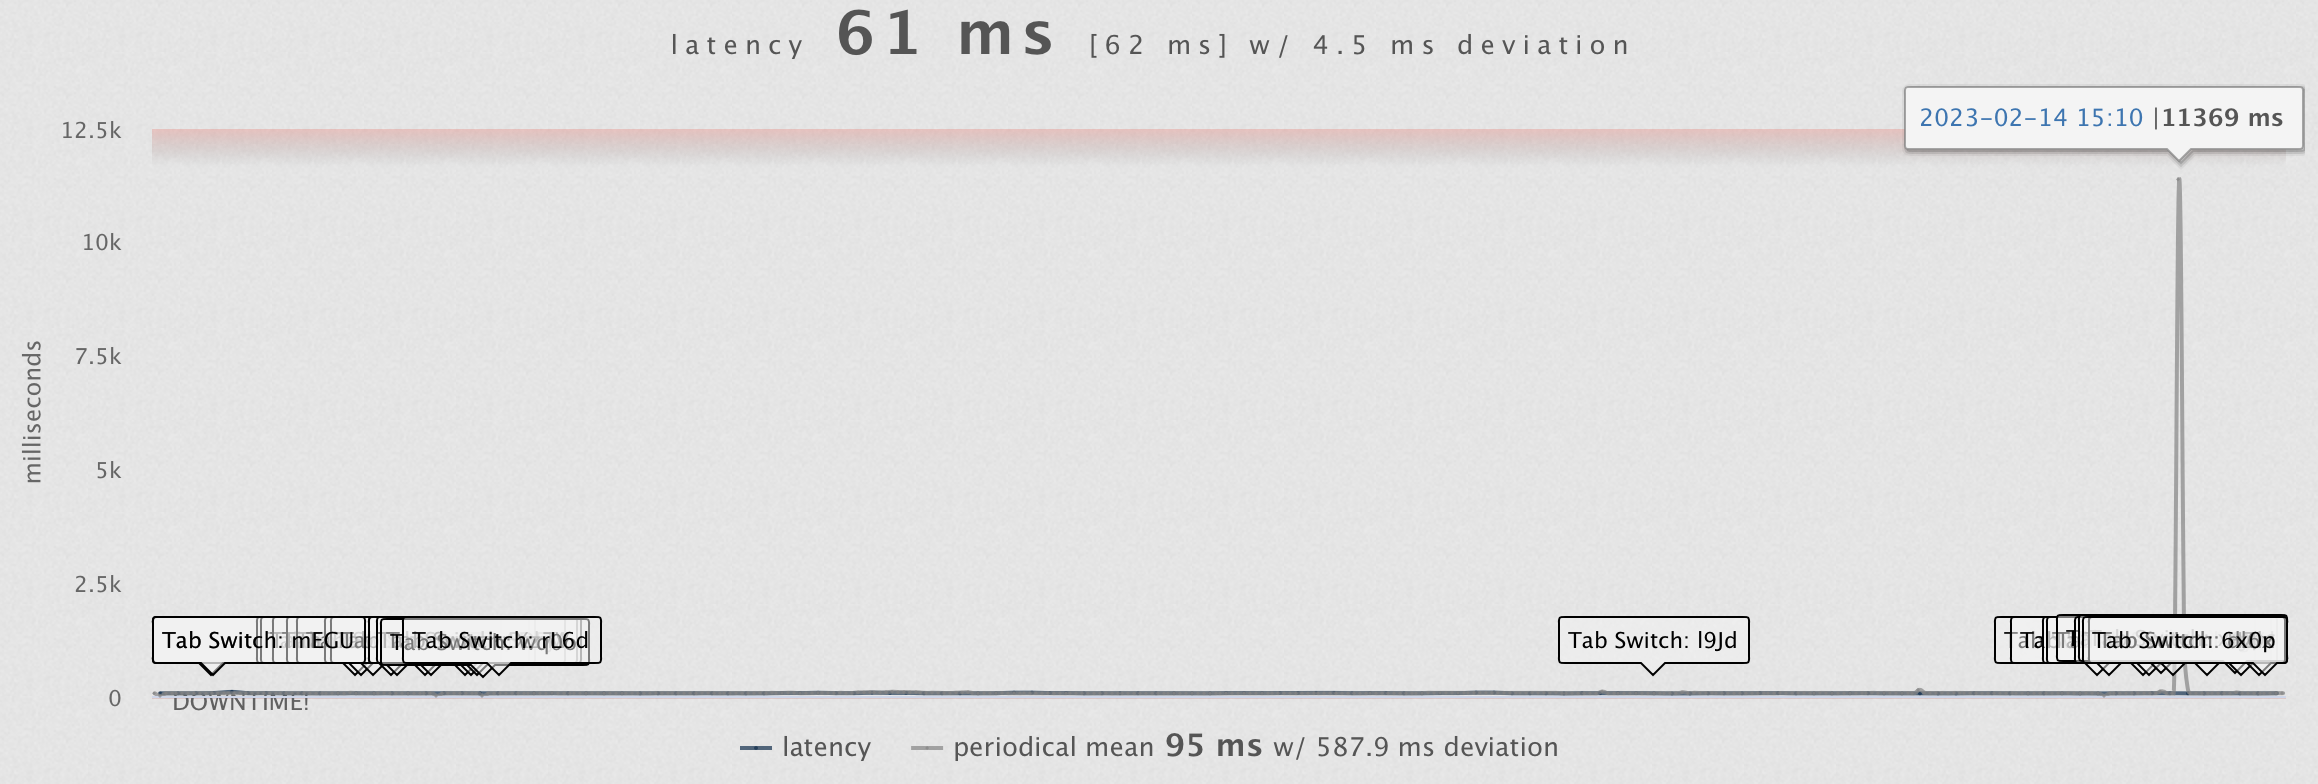
FYI: Huge latency number changed the whole vertical scale, making it look like the line is pegged at the bottom. It sure jumped that standard deviation up (587.9 ms). I guess that's going to stay that way for some time until it drops off the left end of the chart.
-
Missing tests are not documented
CrazyAboutNature replied to CrazyAboutNature's topic in General Discussion
The notifications... tested and working. Yes, you have a difficult task on your hands trying to make all of this digestible. I don't know what an average users' knowledge level of stats is likely to be, nor what their role in using the data would be, so input I have may be off base. I know what the stats terms are, but I don't recall seeing "periodical median", and wonder if saying approximate 24 hr median is clearer (periodical makes me think of magazines/journals, although I understand what your usage is intended to mean). Having said that, I'm not sure what the median tells me; I get what it means, just not sure how that it's useful for me... standard deviation and/or variance seem more helpful for me at first glance). When deviation means standard deviation I would use the full term. I won't pretend to be a statistician or to know what the best stats are for this tool given I've use and who may be using it and for what purpose, so my input may not be applicable. Plus, it's been a very long time since I made extensive use of stats, and even longer since I had stats classes way back when! -
Missing tests are not documented
CrazyAboutNature replied to CrazyAboutNature's topic in General Discussion
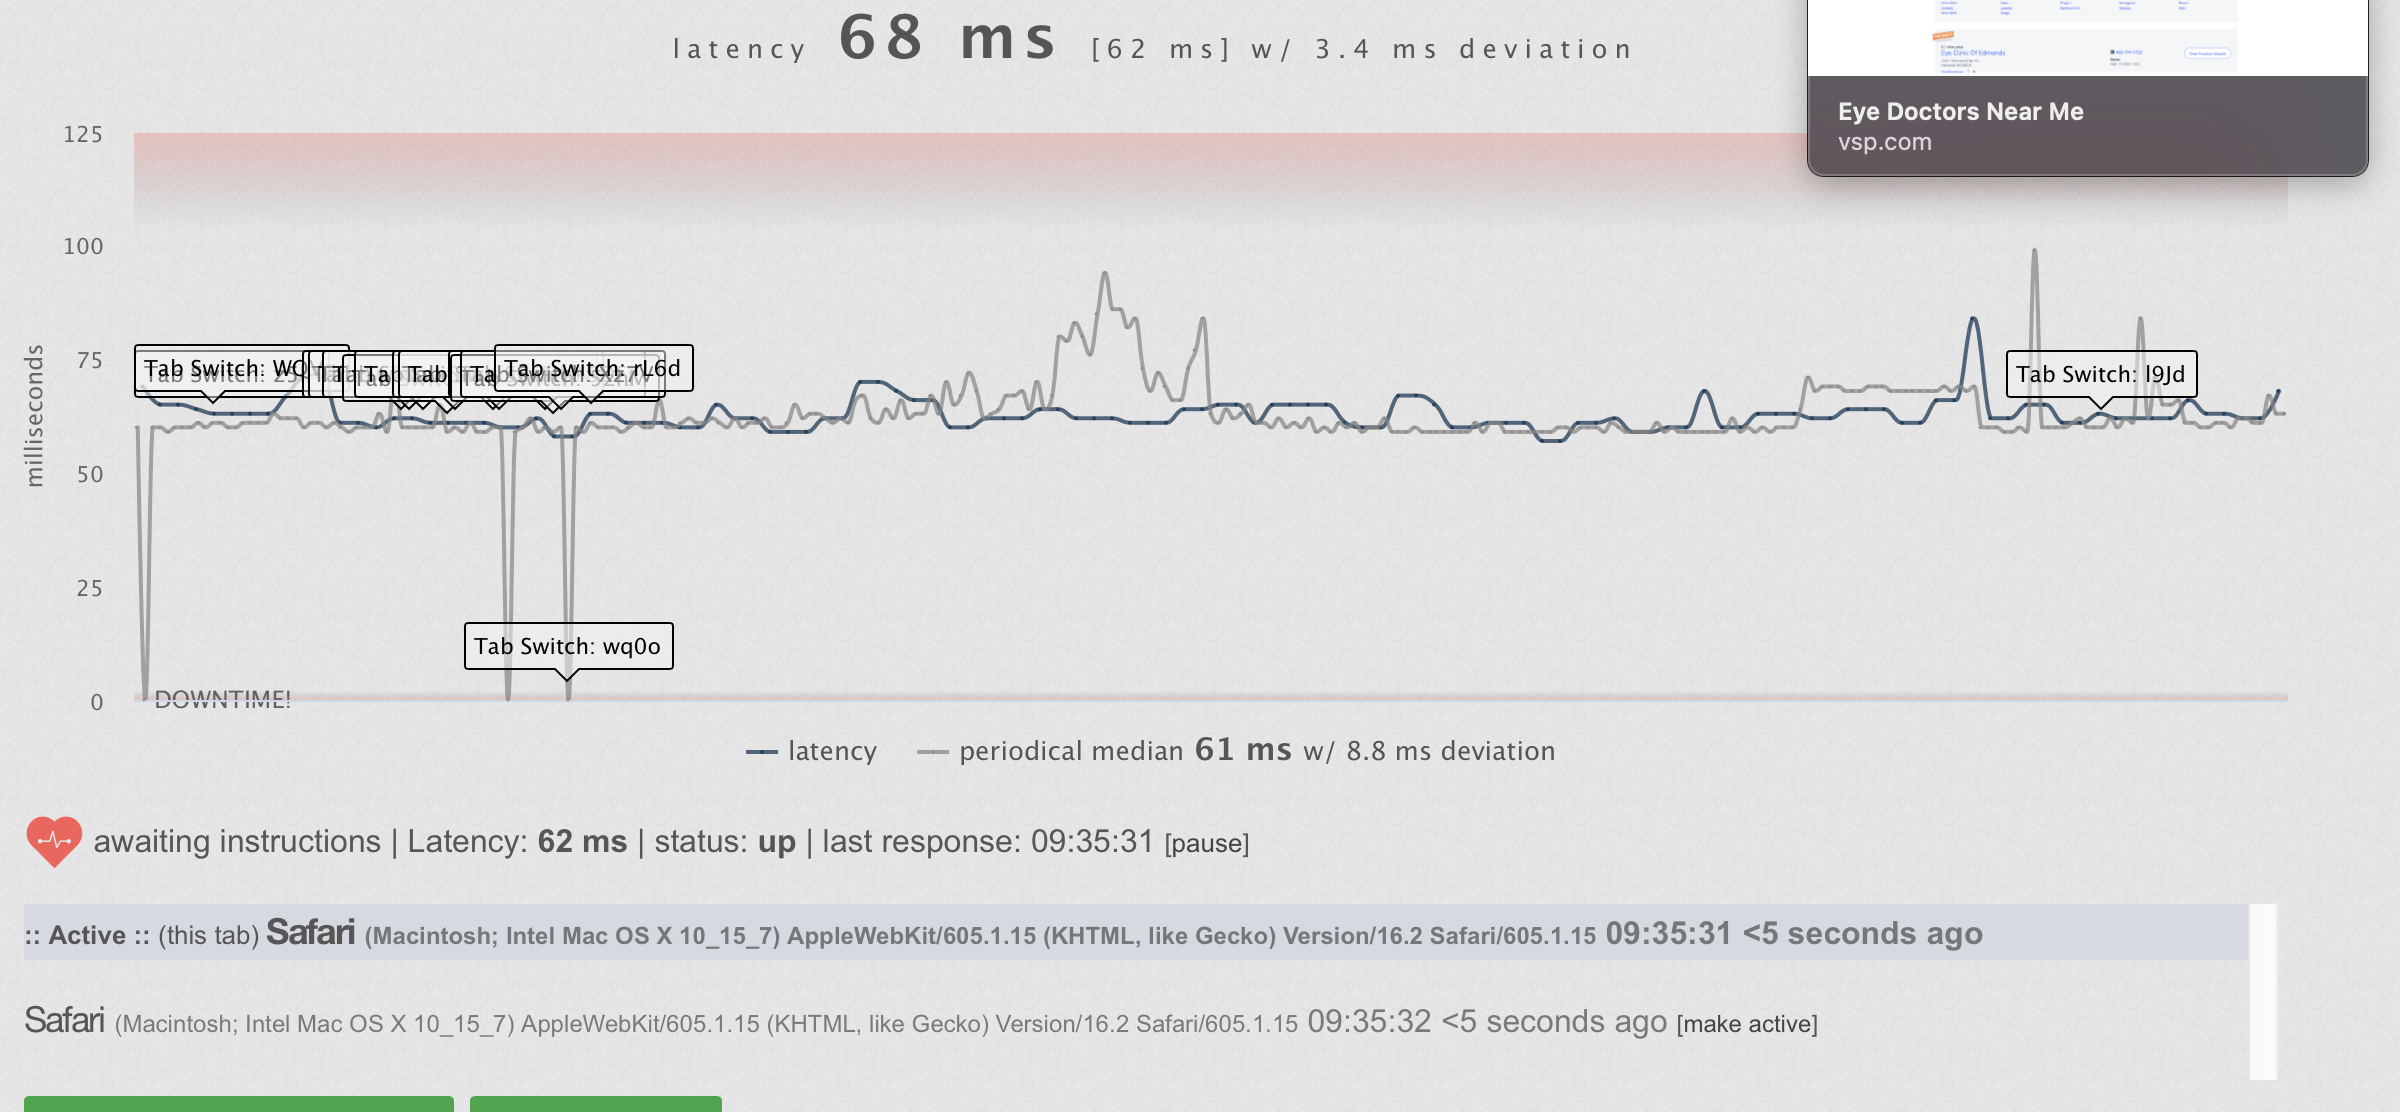
BTW... I'm assuming where it says something like " latency 63 ms (61 ms) w/ 2.3 ms deviation" above the graph, that we're talking the standard deviation. Below it talks of "periodical deviation", and I assume this is the standard deviation for the period of the graph (which is listed as 8.9 ms)? Not sure how this differs from the 63 ms noted above (with 61 ms listed in square brackets - which don't work on my keypad currently). Curious about the numbers given the huge difference in the listed deviation for the slightly different latency figures. Oh, I see, the lower figure is the median. Interesting, how is a deviation (SD) calculated on a median? I could see an SD for a median if you were taking the median for a lot of different charts or people, etc., but don't understand it for my chart.
-
Missing tests are not documented
CrazyAboutNature replied to CrazyAboutNature's topic in General Discussion
My system was mostly down 11-1215, then 3 or so until 6AM. Last night instead of putting the iMac to sleep, I put a screen saver on to darken the screen as much as possible, and unlike the prior night, the 10-minute combined tests seemed to continue. The prior night they stopped, except they occurred once each hour while the iMac was in Sleep mode, although perhaps that was occurring when he drives would wake up intermittently? Yes I don't get any notifications except the blog updates you've posted, I get notifications for those. I'm amazed how steady those latency numbers are. If I just start pinging off of Terminal, those numbers bounce all over the place! -
Missing tests are not documented
CrazyAboutNature replied to CrazyAboutNature's topic in General Discussion
I tried the "Test My Notifications" this AM and noticed it doesn't send me anything. Is it sending it to "Testmy" email address instead? I noticed for my sensor that is the email address listed under "Add Notify Email", and I can't currently change, perhaps because this is just a temporary use of My Sensor...? I thought the app had been down all night for me, because when I refreshed "My Results" it didn't show anything since last night, but this was because the data chosen was still yesterday. I went looking for some indication that my sensor had caught it going down, realized I might not be set up for notifications. Finally I realized even thought I refreshed my results and chose MAX records, that I needed to update the date. Thanks! -
Missing tests are not documented
CrazyAboutNature replied to CrazyAboutNature's topic in General Discussion
FYI: My system crashed about 2:40PM (PST) or so. Also, you asked about my memory... 8GB. My system is challenged however, in that my internal hard drive (multi-TB) and solid state drive (half TB) are not working, and running my iMac off two external drives (each 8TB), and I boot from there. It's all made me think about going back to Windows more than once. -
Missing tests are not documented
CrazyAboutNature replied to CrazyAboutNature's topic in General Discussion
I haven't restarted today but did a couple days ago. It did not seem to be helping with the problem. Will try and figure out where to initiate as My Sensor instead of just my latency. I haven't gotten any alerts about being down, unless those are hidden amongst my emails. I'm going to have to check out to get some sleep and hopefully I can concentrate better later (perhaps not all of this conversation is best for user group) Thanks. -
Missing tests are not documented
CrazyAboutNature replied to CrazyAboutNature's topic in General Discussion
When you say "My Sensor", is that the same as "test my latency?" I see the ongoing testing of throughput/speed went down, I may have inadvertently affected it by putting the iMac in sleep mode which I sometimes do when sleeping. Despite this, I see it did do a test once an hour during this period, between 3 and 6am. SO I guess it's hard for me to say, when it had dropped off a couple days ago, whether this was timing out due to the extremely low bandwidth speed tests, or whether some of it might have been for this reason, although I know that part of that time it was causing time outs or super low speeds on the other internet speed tests. Interestingly, since I reported the super slow speeds overnight to the ISP, I see they have not been occurring over the weekend, although I don't have visibility of speeds during the outage period noted above (3-6AM). -
Missing tests are not documented
CrazyAboutNature replied to CrazyAboutNature's topic in General Discussion
no problem -
Missing tests are not documented
CrazyAboutNature replied to CrazyAboutNature's topic in General Discussion
The app stopped running again about 2 hours ago but just now noticing... -
Missing tests are not documented
CrazyAboutNature replied to CrazyAboutNature's topic in General Discussion
FYI: Not sure, my latency window may have died? Not seeing a note saying "resuming OSD updates..." but not seeing anything change after that. -
Missing tests are not documented
CrazyAboutNature replied to CrazyAboutNature's topic in General Discussion
Don't worry about it on my account, but if you're looking to improve your tool and it helps to do that, go for it. It's been a long time since I've actively done any coding. Looked at php many years back, but wasn't doing anything with it. I've been in IT most of my life, on the project management side. My brother and my son are CSEs, and my father was involved in "Data Processing" way back when. Seems to have been planted in our family. I had Comcast before moving several months ago, but the complex of homes I'm in now apparently does not have the infrastructure to support it, although the Comcast site implies they support my location. I assume my provider is coming across some of the Comcast infrastructure. They only charge 50% of the price, but only provide 25% of the channels, 5% of the bandwidth (I previously had 1.2Gbps), and don't provide the landline I had before! I did get the latency window running. Now just need to cut down on some of the 30 windows I have open! Thanks. -
Missing tests are not documented
CrazyAboutNature replied to CrazyAboutNature's topic in General Discussion
Thanks. I do see a result for 2/11/23, now that I see how to choose a date, but it already has an average for 11PM in the further!? Another issue I notice, is when I changed from a 5-min period to a 15-min period between samples, it still shows on the graph with the same size gap between them (the "My Details" graph. The averages chart shows the gap when readings were not taken or available, although the My Details chart just assumes consecutive data points without a time scale. I can probably make use of the averages chart instread (unless there are regular stray data points like the 11PM that hasn't occurred yet). -
Missing tests are not documented
CrazyAboutNature replied to CrazyAboutNature's topic in General Discussion
Just encountered another problem - the instance of testmt.net that I was running stopped for some reason, around 10:30AM (PST), even though I seemed to be getting bandwidth at that time. I just restarted it to run every 15 minutes. (Also some other issues, like displaying "my averages", seems to display previous day and not let me display current day in progress. On My Details, the upper chart displays no vertical lines showing hour or data between the data.) When you say start a new browser, do you mean browser instance (like another Safari window for testmy.net? Or, are you suggesting a simplified browser that can run with little impact on the computer or other apps running? I don't have any working knowledge of docker / raspberry pi. I've been checking for messages and checking my email so I've seen your replies without issues. My Sensor - is that running periodic latency tests only? Seems like I bumped into that because I recognize the curve output. I may be a little slow on the uptake here... Thanks. -
Missing tests are not documented
CrazyAboutNature replied to CrazyAboutNature's topic in General Discussion
Thanks! -
At times, perhaps because there is a timeout (?), no data is returned. When the details are graphed out, they are continuous and just skip missing data and treat it as though there was no gap in the time period. I'm trying to show my ISP when their performance is slow, or when there are total gaps in it, but these graphs and data results don't help to document when a report could not / was not generated. In several cases I have documented this to be when other available speediest are either timing out or showing grossly underperforming speed. There was a 4-5 hour gap in the data this morning, and I have no clue whether the utility was timing out or if something else was going on.