
Pgoodwin1
-
Posts
1,004 -
Joined
-
Last visited
-
Days Won
94 -
Speed Test
My Results
5 Followers


About Pgoodwin1

- Birthday 05/01/1948
Recent Profile Visitors
18,514 profile views


Pgoodwin1's Achievements
-
 Pgoodwin1 reacted to a post in a topic:
How to get Internet Companies to recognize testmy.net
Pgoodwin1 reacted to a post in a topic:
How to get Internet Companies to recognize testmy.net
-
 CA3LE reacted to a post in a topic:
IS there an OPTions to download the test data in CSV format ?
CA3LE reacted to a post in a topic:
IS there an OPTions to download the test data in CSV format ?
-

IS there an OPTions to download the test data in CSV format ?
Pgoodwin1 replied to ixiz's topic in General Discussion
There’s an Export button under the plots on the Results page- 1 reply
-
- 1
-
-
Pgoodwin1 reacted to a post in a topic:
How to separate results via router?
-
@CA3LE Good stuff. Another suggested improvement on the results page, in addition to filtering results by Identifier (suggested improvement), it would be nice to filter the results by test type. So be able to filter and show only the New process, or only show the Linear process, or both. That way we can compare our new Linear results to older classic linear test results, and be comparing apples to apples over time. I think you need a for the new test method. The Linear process name is good, but the new test process name is “Start”
-
I just saw the explanations below the test start page. I’ll read that
-
I just started using the Beta. Couple of questions do you have a section where you explain the difference between the Start and the Linear test? I’m getting higher results when I just select start. Never mind -see comment below is there a way to set the Identifier - like Living Room in the Beta? suggestion- add a Retest button when a test completes. so far I like it. Just got started
-
xCON reacted to a post in a topic:
2gb symmetrical fiber
-
Pgoodwin1 reacted to a post in a topic:
Don't trust, verify. I'm giving you ways to verify.
-
Your TestMy.net results are very good too
-
Where are you located?
-
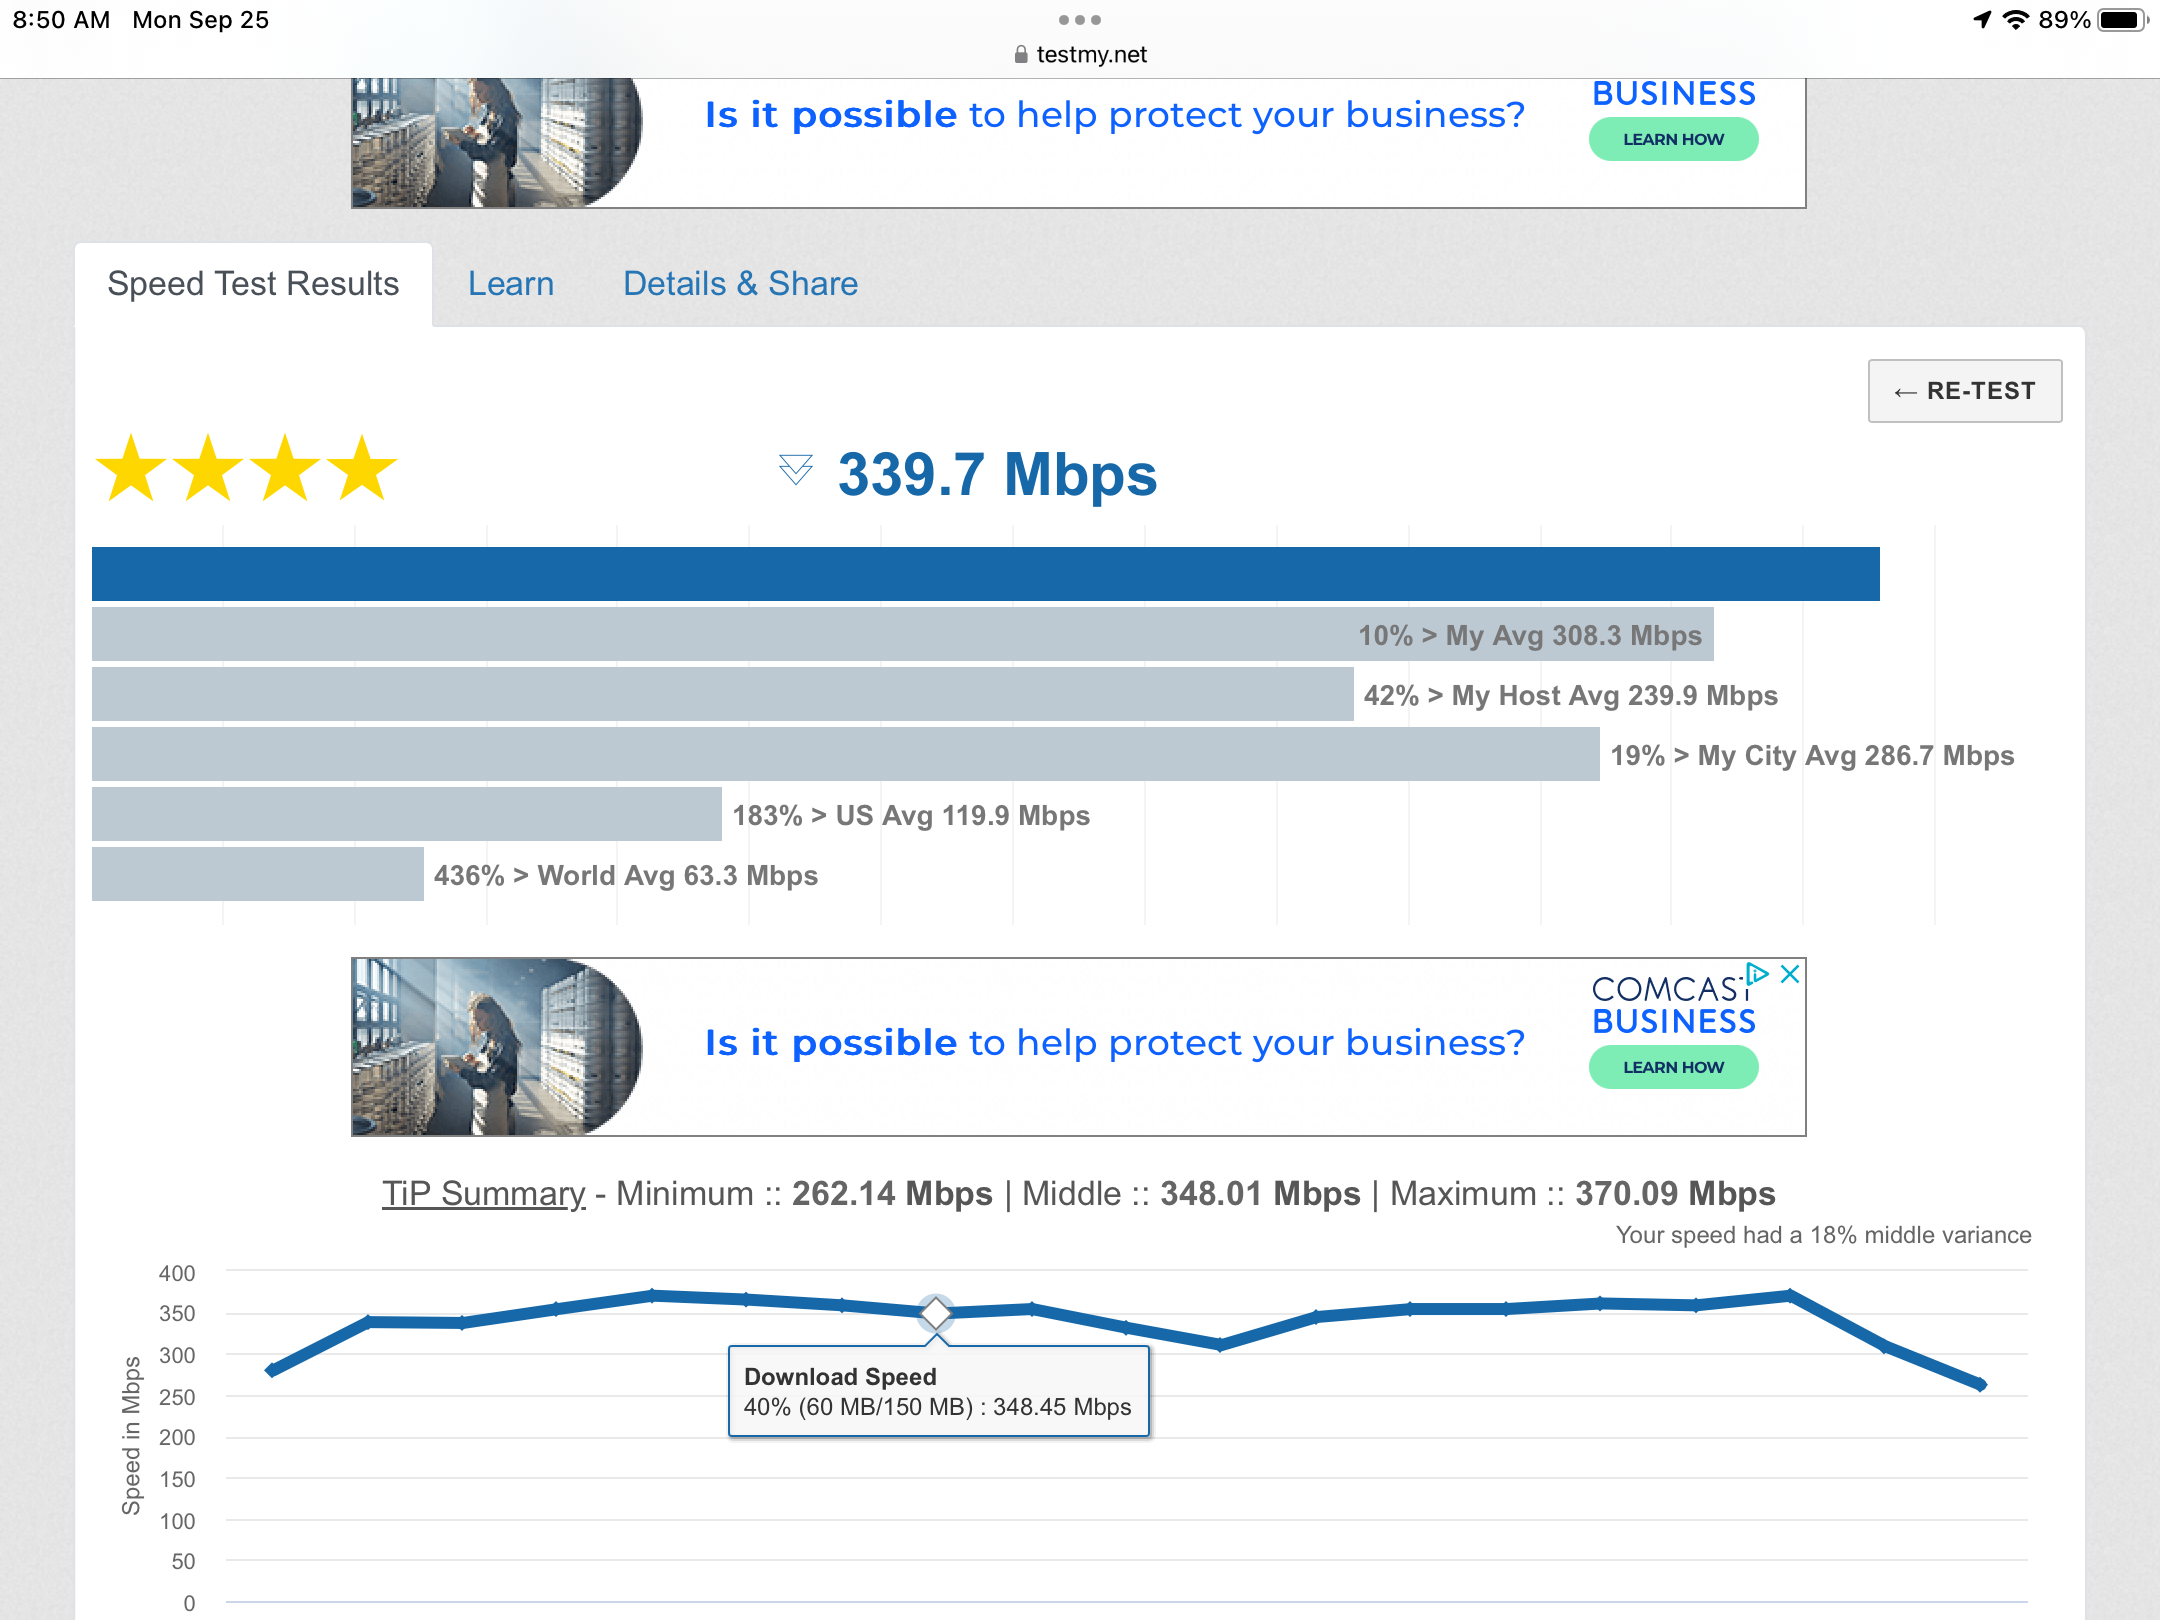
On the individual download test plot - your first plot, I’ll let CA3LE explain it correctly. The way I understand it is that the plot is for the computed speeds at points along the path to the test server. If you select points along the plot, it’s shows a percent. I’m not sure what the percent is representing. % of test time ?

-
Yes. Yours is looking like it should
-
-
-
xs1 reacted to a post in a topic:
A RECENT CHANGE? BROKEN UPLOAD REPORTING?
-
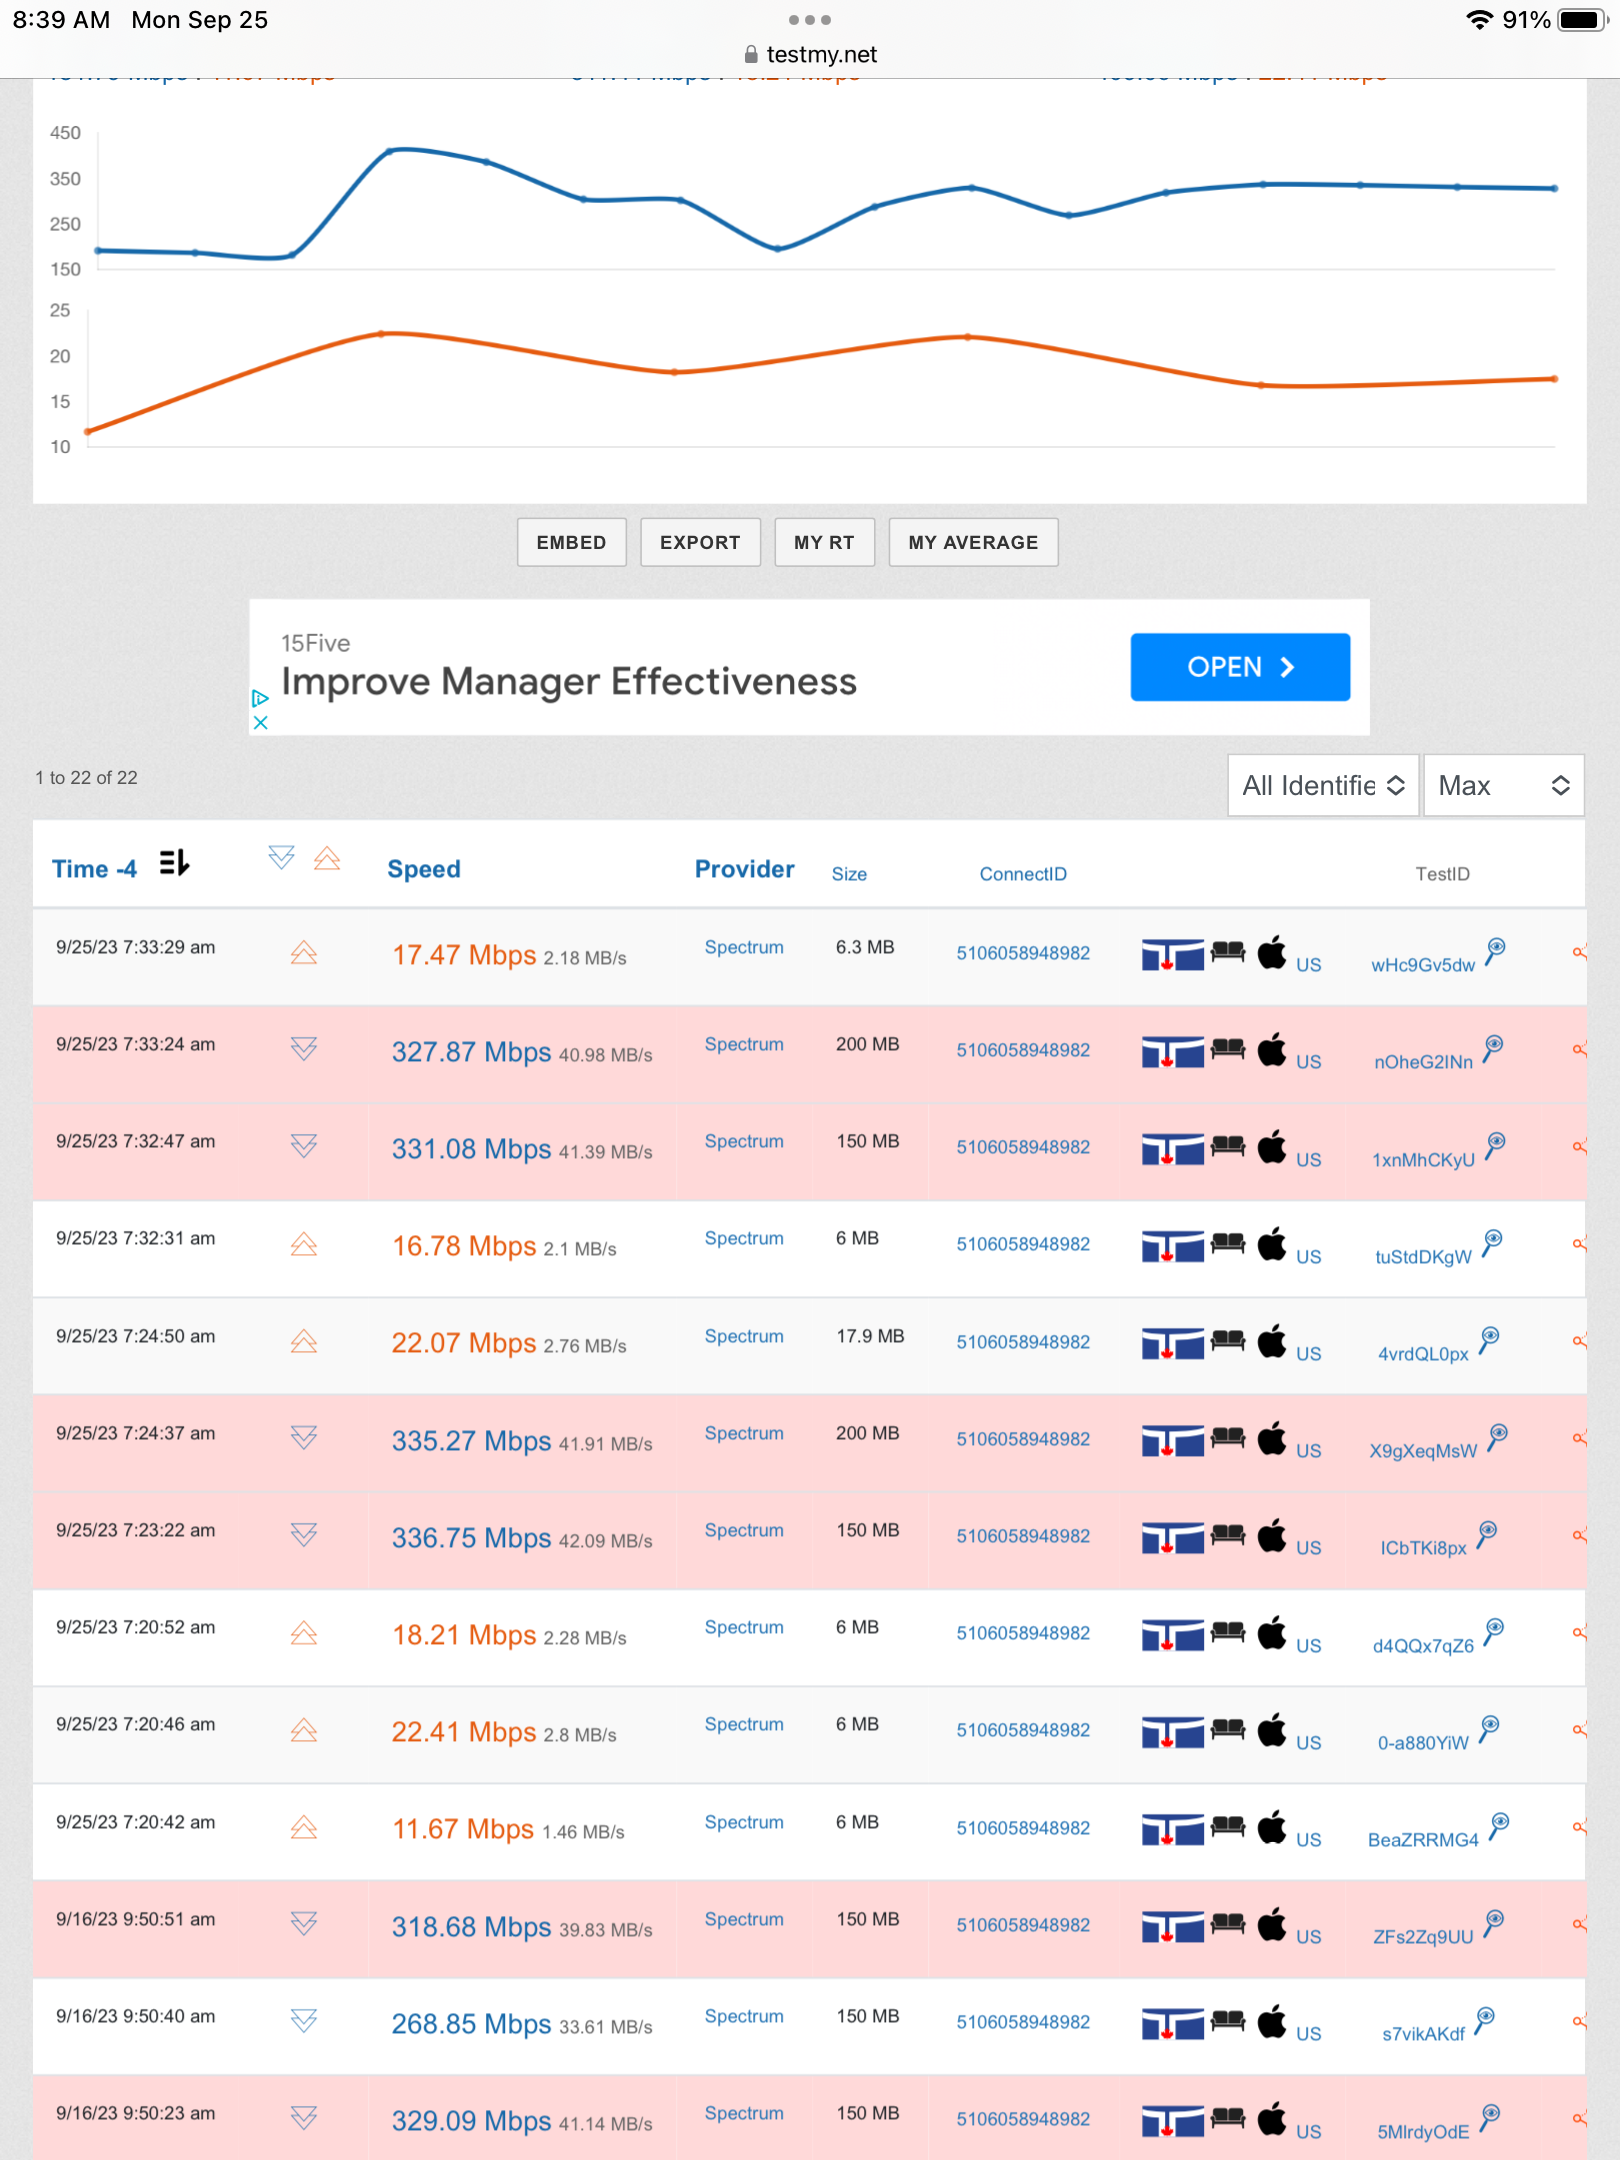
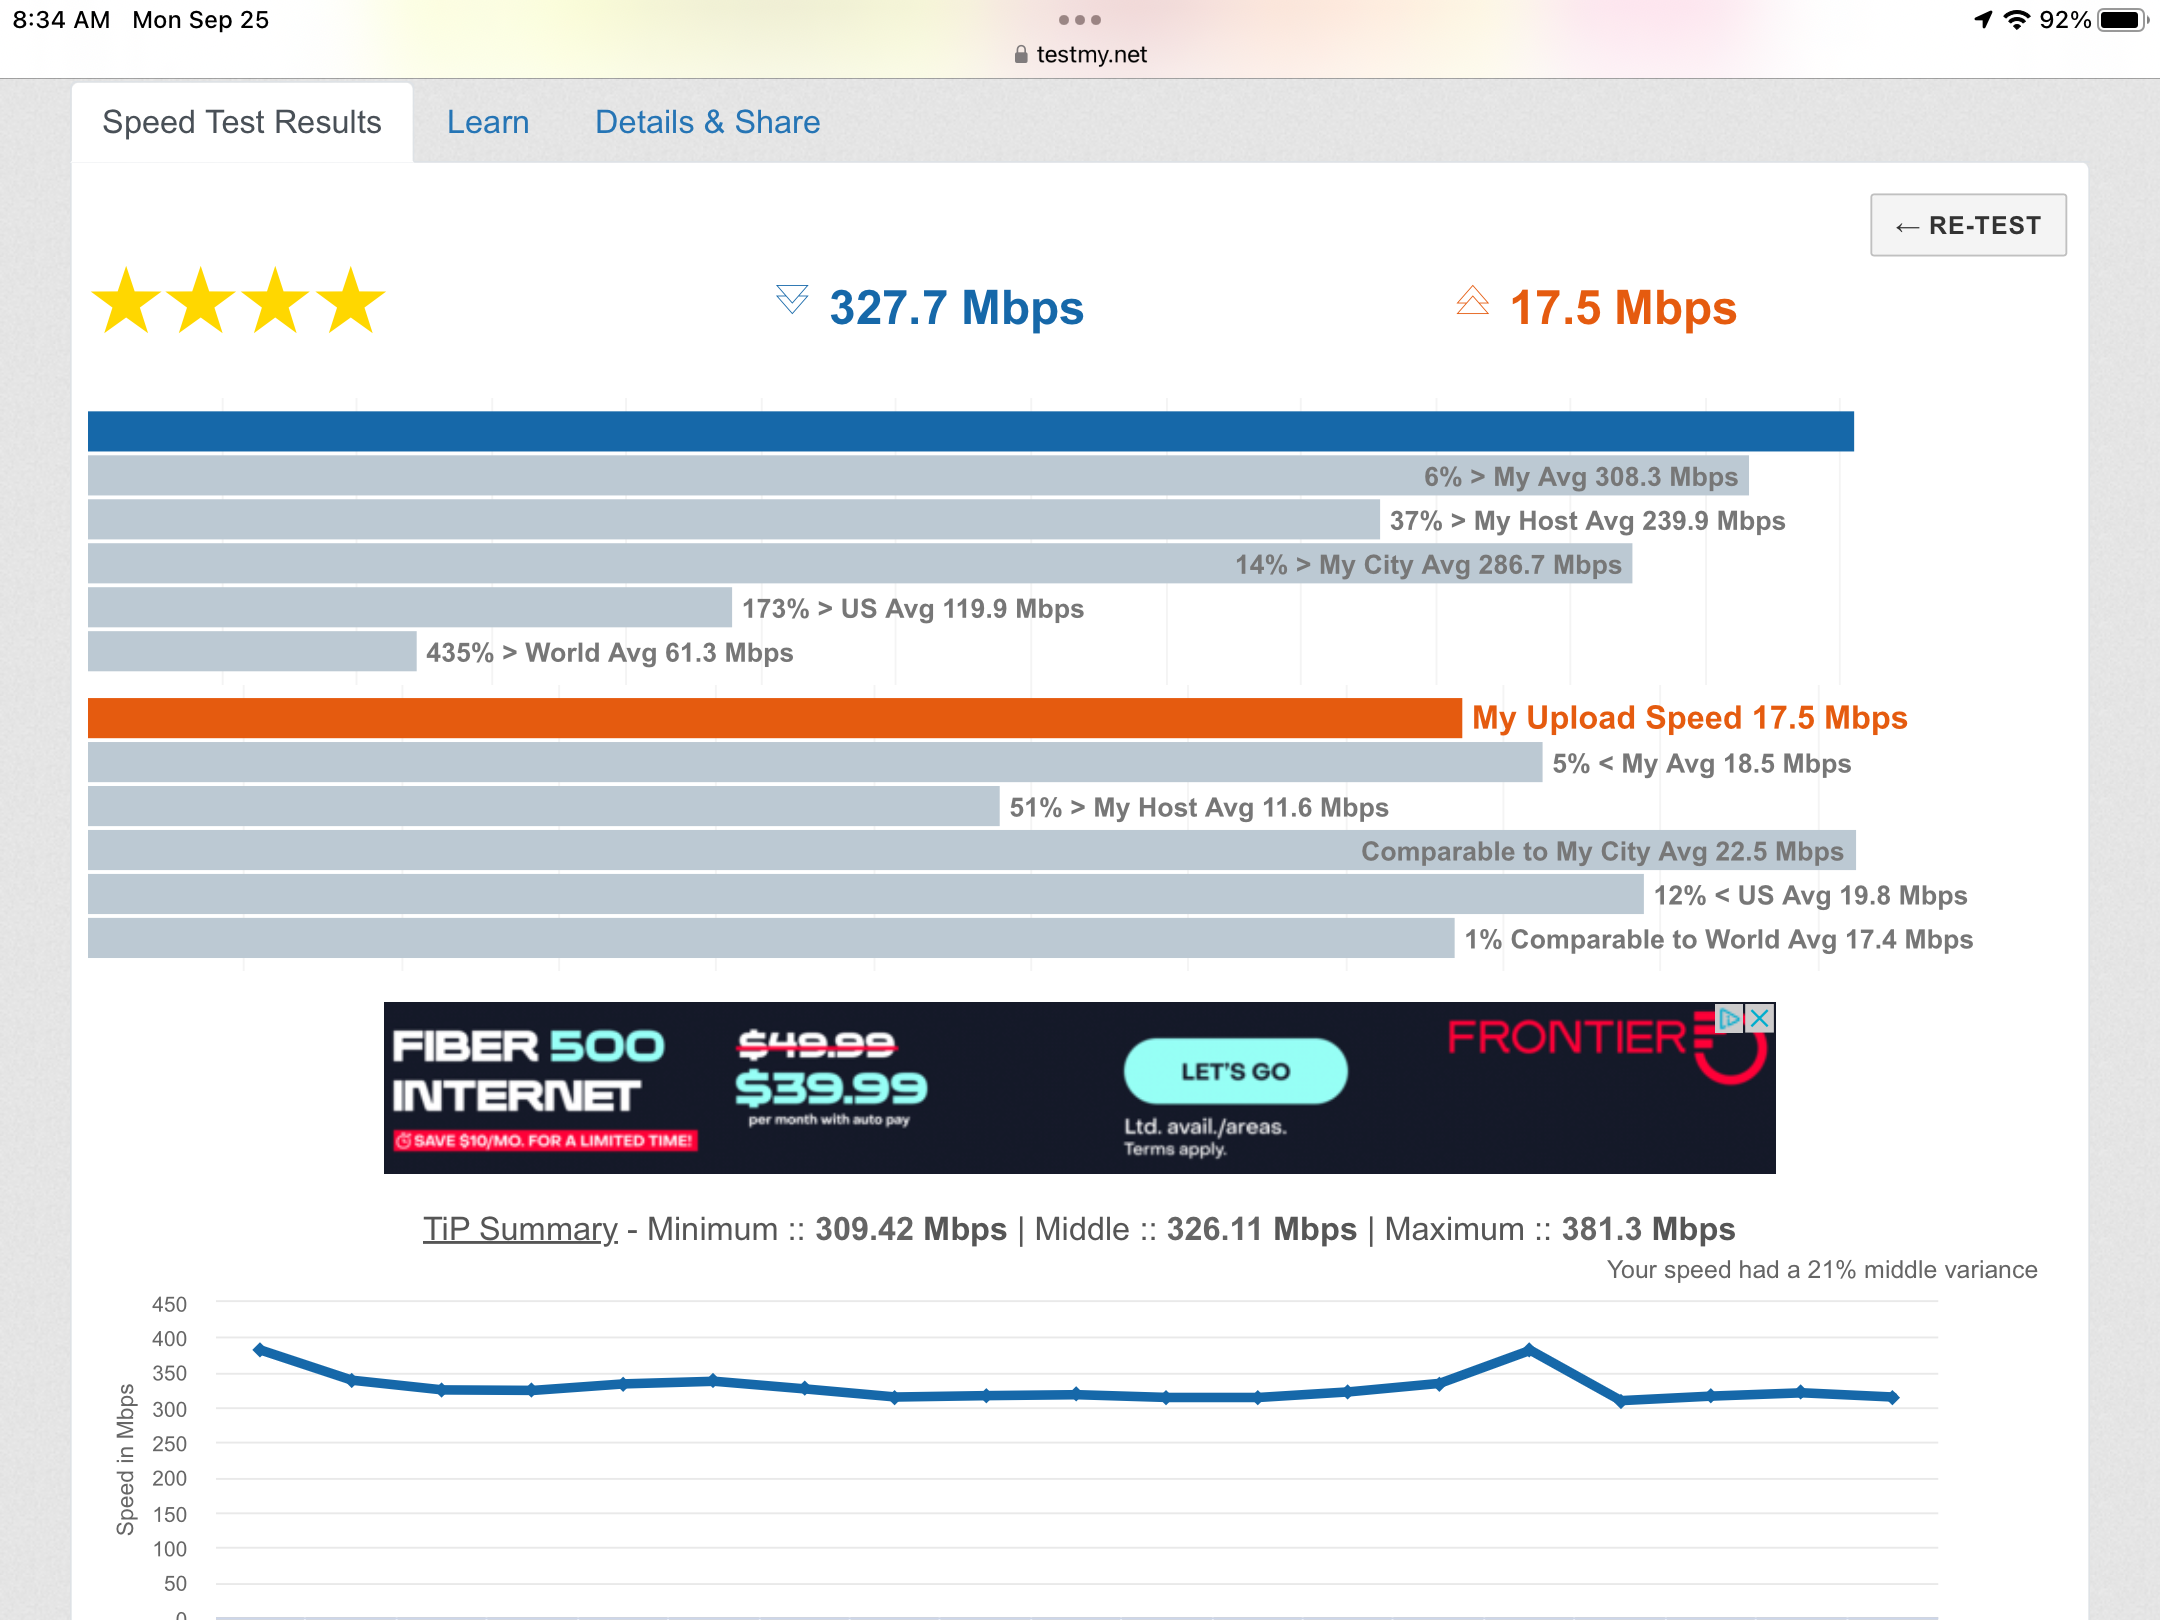
The upload test results don’t normally show a plot like download after a combined upload/download test. The two tests are different type tests. if you want to see plots containing download test points, go to the My Results page. The upload and download both plot on that page because it’s showing results from multiple tests over the date range selected - assuming you have test data for both for the date range you select
-
Pgoodwin1 reacted to a post in a topic:
Strange limitation on upload speed measurement only with TMN
-
Ask friends or neighbors that have the same plan as you whether their performance is similar
-
Pgoodwin1 reacted to a post in a topic:
10,000 Mbps Internet
-
Pgoodwin1 reacted to a post in a topic:
Where Do You Live?
-
Pgoodwin1 reacted to a post in a topic:
Upgraded every cable in my network
-
@CA3LE I just noticed your location. … the matrix. Haha
-
Pgoodwin1 reacted to a post in a topic:
Mobile test
-
I’m not familiar with that device.
-
Pgoodwin1 reacted to a post in a topic:
Automatic repeating speed test (but generated at random intervals)
-
I see no logged test results under your user name