Leaderboard


Popular Content
Showing content with the highest reputation on 09/10/2024 in all areas
-

Sharing My Average
Jose Fernandes reacted to julio1909 for a topic
myaverage?q=91383589954064&type=Comp_ID&var=Month1 point -
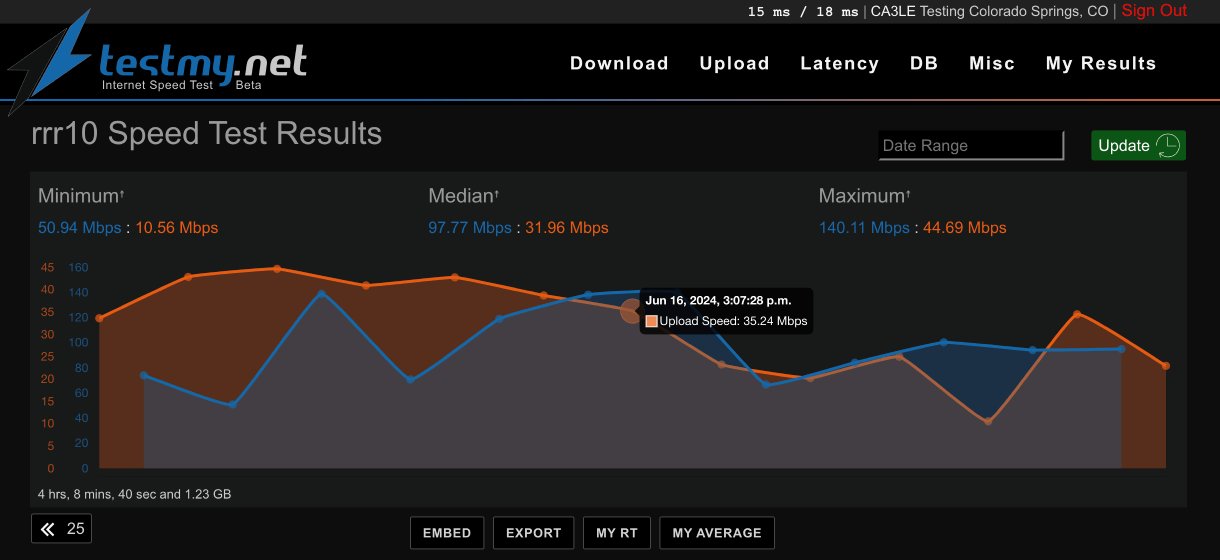
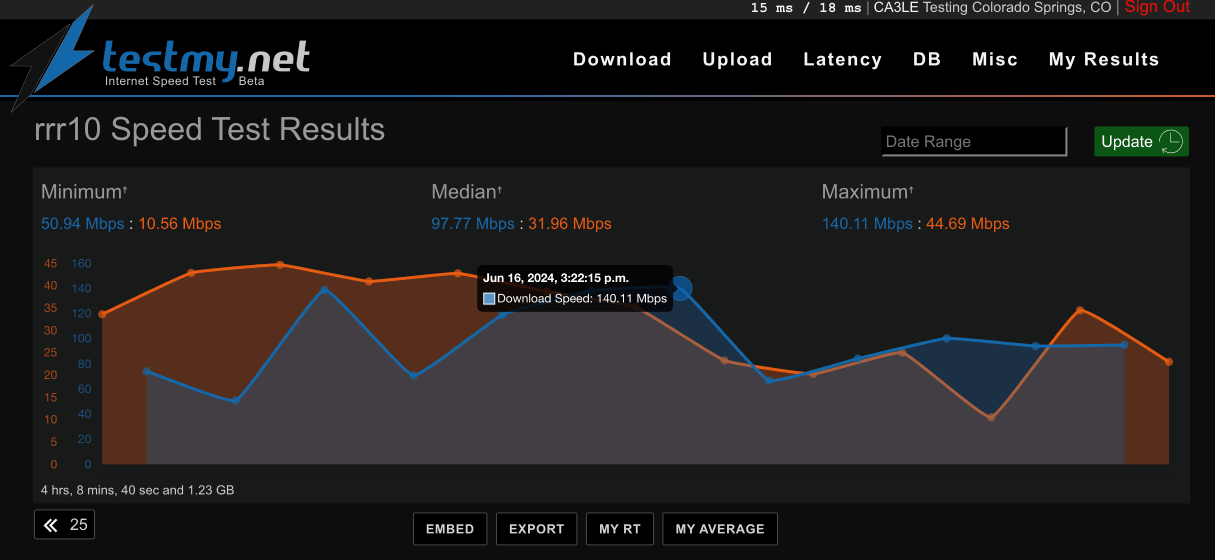
Hi, When I view the 'My Results' graph, the x-axis is the day and time of the tests. Many times at a particular point on the x-axis there can be a download result at a different day and/or time than an upload result. I would expect that they both would have the same time stamp at a point on the x-axis. Does this make sense? Can this be fixed? thx Rod1 point
-
Hi Rod, I'm happy to see that you're still visiting. I was optimizing the query structure of the database search. This presented a new problem because now certain calculations are done later in the process. Not really an issue, we can work with that, especially given the performance gains of dropping 2/3 of the queries... except I can't tell if there should or shouldn't be a graph displayed early enough in the process to generate the page structure the way I wanted. A problem easily solved if it was a single graph. Instead of just making it work... I rebuilt it into a single graph. Along the way I finally solved the x-axis / y-axis. There are two separate y-axis for speed and then two x-axis for date. The dates align with each other properly now on the x-axis no matter what the situation. This update also makes DB search query much faster for members like you with over 100,000 results. My testing saw no less than 2X increase in speed, some queries saw as much as 6X improvement. Once I thought of how it could be done (early yesterday) it was mostly a matter of reorganizing. Still a good 20-30 hours of programming, lol. Numerous other bug fixes, more complex queries are possible. Thank you @Pgoodwin1 for the suggestions, got the juices flowing. Thank you @rrr10 -- sorry it took >5 years to program your suggestion. It's a harder problem than I ever could have imagined. No examples to go off of, very little documentation of this very specific use case. I guess not very many people want to combine charts in this way... well, I like it. I can see how it will help people understand results better. I hope you like it too.
 1 point