Leaderboard


Popular Content
Showing content with the highest reputation on 05/26/2019 in all areas
-
Thanks, I'm surprised there hasn't been more response to this. It's pretty much the most powerful tool I've ever built... statistically speaking. Personally, I love it. My Average also works with all of the ISPs, cities and countries in the database. Those areas are in development but will be released in iterations soon. I'm using it right now and... to me, it's crazy to see years of data plotted out in front of me, so quickly. Many of the queries aren't even close to optimized or indexed but it can still make it happen like lightning. Around 2011/2012 I changed the way providers were being logged to the database, this tool combines the old data with the new data for its calculations so I'm able to get full records going back to 2005. All in milliseconds. (actually the database predates that but an early error reset all of the dates to 2005... whoops! Too late by the time I noticed. Live, learn, be happy.) These are extremely heavy queries to the database but using some of the same strategies that I use for hoststats I'm able to make these pages render for you in under 0.05 seconds. Behind the scenes these queries take minutes but TMN is in the background pre-fetching and caching calculations. Check out how much Hughes Net has improved over the years. LOL, that 2nd video was copyright claimed for the audio before I could even post this. (I mean right as I pasted the link) Youtube is on it! That's good, that dude deserves credit. So you might see ads just on that 2nd video... just wanted to share what I was really listening to right now.1 point
-
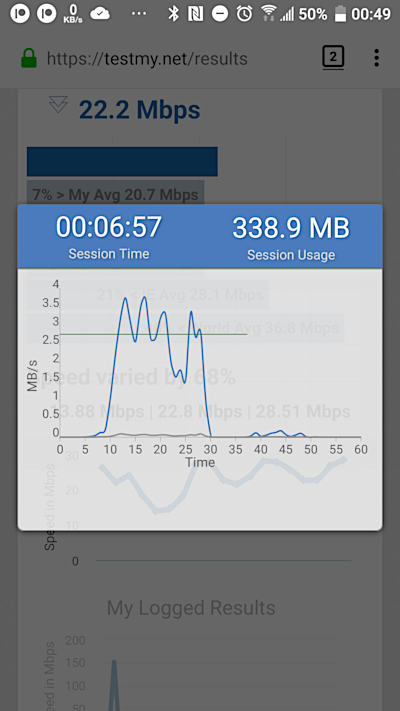
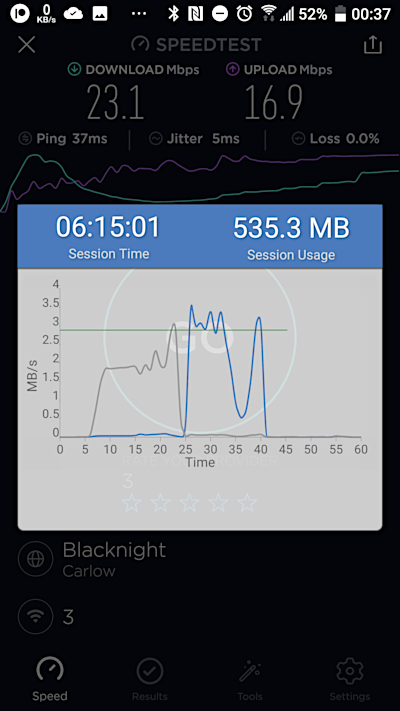
As my Internet connection throughput intermittently dips due to running on a cellular 4G network, I was curious to see how well the Internet Speed Meter app handles fluctuating traffic. From running linear and multithreaded tests with TestMy, it corresponds reasonably well with TestMy on download tests. Things got a little interesting when I ran Ookla's Speed test where my connection throughput fluctuated during the test. Here are the two full-screen screenshots. In the above graphs, I drew in horizontal lines for each 0.5MB/s. In the graphs below, I drew the green line based on the download test result divided by 8 for MB/s, calculated to the nearest pixel: _ The reason I picked these two graphs is that the traffic graphs were very similar, apart from a deeper dip during Ookla's speed test. That didn't stop it producing a faster result! These graphs clearly show the two different methodologies these speed tests take. To my eyes with the left graph, the area of the spikes above the green line will roughly fill the valleys below it. So I have no doubt I was averaging about 22Mbps at the time. As for the right graph, there's no way I was averaging 23Mbps during that test. This is a clear example of Speedtest's methodology "The fastest 10% and slowest 30% of your results are DISCARDED". During this test, I saw the speedometer hit 26Mbps briefly before dipping to the low teens for a few seconds, then gradually climbed until it hit the 23 figure just be fore the download stage ended.
 1 point
 -
Hello Lisa, Your information seem partial, so lets try to figure out few things. Games on your phone: Do you have iPhone or Android device? Are you connected to Data (3G/4G/LTE) or Wifi? If you are at home and connected to wifi, is your wifi actually connected with "No internet"? you might have a routing issue. If other devices work fine in your home network but not your phone, try "forgetting network" on your phone and reconnecting and re-entering the password. Hope this starts you in the right direction. Cheers! Also. Welcome to TMN!1 point
-
Oh this is nice.1 point